Data Analysis
How will data be analyzed on my computer?
The two LIGO detectors and GEO 600 each have their own large collection of data. In order to sort through all of this data and find gravitational wave signals, the data has to be broken into small sets that can be processed by individual computers.
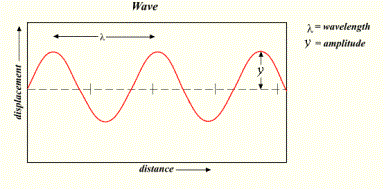
Each computer gets data corresponding to a specific area of sky and a specific time interval. Each computer also gets a model of what scientists think a pulsar signal from that part of the sky should look like in the data. Pulsar signals are expected to be sine waves, like the one shown below.

A sine wave is the graph of the equation y = sin x. A sine wave has the same amplitude (distance from centerline to the top of a peak) and wavelength (distance from peak to peak) over time.
A wave that repeats, like the one above, is called a periodic wave. In addition to amplitude and wavelength, a periodic wave is characterized by its frequency. The frequency of a wave is the number of wavelengths that pass a given point in one second. Gravitational waves signals look like sine waves and occur at different frequencies that depend on their source.
The data each computer gets is in the form of a complicated wave, so the computer first does a Fourier transform on the data. A Fourier transform is kind of like taking apart a puzzle, you start with a completed picture and end up with smaller pieces that each make up part of the whole. A Fourier transform does this, but with waves. It takes a completed wave and splits it into smaller waves that each make up part of the whole. Each of these pieces is a sine wave with a different frequency.
Once the computer splits the signal into sine waves with different frequencies, it compares the model for a pulsar signal with the sine waves your computer found. If there is a match, your computer sends a message back to the central server and the data is analyzed again by two other computers. If all three computers agree, researchers will further analyze that data to determine whether the signal is from a gravitational wave or a local disturbance. They do this by comparing their data to data from other detectors.
If your analysis doesn’t match the model, your computer sends that message back to the central server. The same data is analyzed by at least one other computer to check for mistakes, but if none are found then the data won’t be analyzed any more.
This analysis requires a lot of computer processing. That is why we need your help!
Get Involved!
Einstein@Home depends on private owners of PCs donating computer time. To participate in this worldwide project, all you have to do is install a small screen saver program on your computer. The program only runs when you're not using the computer or when you turn it on. Einstein@Home will not affect your computer's performance. Screen savers are available for Linux, Windows and Mac operating systems.


