The Theory of Everything... Everything Alive!
About Biological Scaling
Physicists like to explain a broad range of phenomena with a few simple mathematical laws. For example, Newton’s laws explain how objects fall on Earth, how the planets move in the solar system, and how stars move around the center of their galaxies. Armed with this approach, and an array of sophisticated mathematical tools, physicists sometimes tackle problems in unexpected areas—including biodiversity and the characteristics of large and small organisms.
| Heart Rates for Various Mammals (beats/minute) | |
| Whale | 20 |
| Horse | 45 |
| Human | 70 |
| Cat | 150 |
| Hamster | 330 |
| Shrew | 600 |

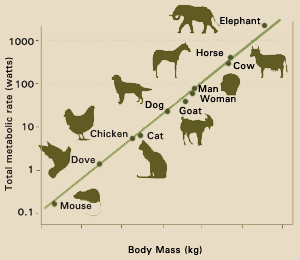
This graph shows the relationship between the total metabolic rate of various mammals and their body mass. (Graph courtesy of Knut Schmidt-Nielsen, from Scaling: Why is Animal Size So Important?)
A long-standing puzzle in biology has been the relationship between the size of an organism and various characteristics related to its consumption of energy. As a simple example, the table shows how the heart rate of various organisms changes with their body mass.
A more general approach is to compare the metabolic rate—how rapidly the organism consumes energy—with the body mass, and the graph shows the relationship. Note that both axes of the graph are laid off as log scales. On this kind of graph, organisms from the mouse to the elephant all lie on the same straight line, which immediately suggests that there ought to be some explanation that would apply across the tremendous range of sizes shown, about a factor of 100,000 from smallest to largest.
There’s an old joke about physicists: Ask a physicist to think about a dairy farm, and the she or he will say, “Consider a spherical cow.” The idea here is that the physicist has chosen, for openers, the simplest possible model, and if that produces a theory that agrees with observation, then the physicist must be on the right track.
Suppose all animals were spherical. Then, according to solid geometry, their radii, areas, and volumes would be related like this:
- Surface area is proportional to the radius squared.
- Volume is proportional to the radius cubed.
The amount of heat the animal produces is proportional to its volume—to the number of cells. The rate of heat loss is proportional to its area, since heat escapes at the surface.
Now let’s compare large and small animals. As animal size increases, the volume goes up faster than its area (the radius cubed increases faster than the radius squared). This means that a bigger animal loses less heat, in proportion to its volume, than a smaller one. This explains the fact that larger animals tend to live further from the equator. However, it does not explain the relationship shown in the graph above, a mystery that has stymied generations of biologists.
Research
Two biologists, Jim Brown and Brian Enquist, and a physicist, Geoffrey West, had been considering this problem independently. Brought together at the Santa Fe Institute, which encourages interdisciplinary problem-solving, they began to collaborate in the mid-1990s. Their approach centered on the geometry of an organism’s circulatory system, with these assumptions:
- An organism’s circulatory system extends throughout the organism.
- The circulatory system operates as efficiently as possible, requiring the minimum possible energy to transport nutrients.
- The smallest vessels, capillaries in animals and xylem in plants, all have the same size.
From these simple assumptions, the three scientists built a model of circulatory systems that, among other things, explained the relationship between organism mass and metabolic rate, creating a sensation among biologists and physicists alike. Other physicists weighed in with a simpler theory, and then Brown, Enquist, and West responded with a substantial revision of their own ideas. Much controversy remains, and this area of research promises to be exciting for some time to come.

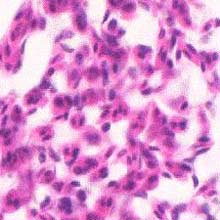
Capillaries in a bird's lung, with red blood cells clearly visible. The white spaces are passageways for air that loop among the capillaries (photo courtesy of Thomas Caceci Virginia-Maryland Regional College of Veterinary Medicine)
Links
Physics World
University of New Mexico
Science
Sante Fe Institute Bulletin

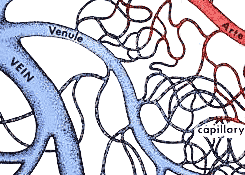
Schematic drawing of the human circulatory system (used by permission of Carolina Biological Supply Company, Burlington, NC 27215)


