Catch an Earthquake
San Francisco and Los Angeles, home to about 7.5 million people and to much of the economy of California, lie close to the infamous San Andreas fault, as shown in the map. This fault is the boundary between huge crustal plates that grind past each other (see drawing), moving on the average a few centimeters per year. But the plates near both San Francisco and Los Angeles are locked, accumulating stored energy to be released, perhaps, in the next “Big One.”
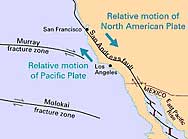
The San Andreas Fault, the boundary of the North American and Pacific plates. On the average these plates move a few centimeters a year (image courtesy of U. S. Geological Survey)
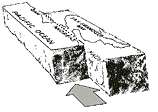
Large blocks, themselves parts of huge crustal plates, sliding laterally along the San Andreas Fault (image courtesy of U. S. Geological Survey).
In 1906 the great San Francisco earthquake, along with the fires it started, destroyed most of the city. The next one of this magnitude—7.8 on the Richter scale—is not expected for about another 100 years from now. Nevertheless, the United States Geological Survey (USGS) sees a 62% chance of a magnitude 6.7 or greater quake in the Bay area by 2032. In southern California, the last serious quake was in Northridge in 1994, with magnitude 6.7, and it caused $20 billion dollars of damage.
Successful earthquake prediction could save many hundreds of thousands of lives, but so far the results have been mixed at best. In 1975, Chinese officials, alerted by a series of foreshocks, averted a huge disaster by evacuating the city of Haicheng only a few days before a devastating quake. Nevertheless, in the very next year an even larger one struck Tangshan, killing 250,000 but without any warning at all.
In California in the late 1970s, USGS geophysicists embarked upon a long-term study of earthquake warning signs by heavily instrumenting the region around the small town of Parkfield, which sits astride the San Andreas fault. At Parkfield, the plates are not locked in place but slip sideways over time.
Parkfield has an interesting seismological history. The timeline shows its past six major earthquakes, which have an average spacing of 22 years, leading to the prediction that the next such quake would come in the 1980s or early 1990s. This regular spacing strongly indicates a process of a sudden release of stress in the quake and then a gradual rebuilding over time, due to the steady movements of the plates.

Timeline of Magnitude 6 or greater earthquakes in the Parkfield area; note the regular spacing, up until the 1980s and 1990s.
Examination of seismological records provides further evidence. The drawings show the north-south and east-west ground movements in the Parkfield earthquakes of 1922 and 1934. The similarity in the pairs of tracings suggests that both earthquakes were caused by a rupture at the same location along the fault.
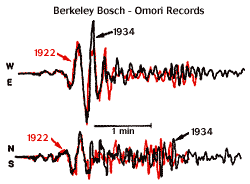
Superimposed seismograms of two earthquakes at Parkfield, one in 1922 and one in 1934. The similarity suggests that these were ruptures at the same place in the San Andreas Fault (image courtesy of U. S. Geological Survey).
Research
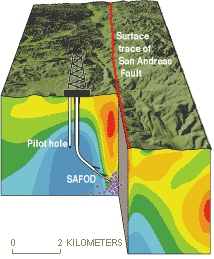
The San Andreas Fault Observatory at Depth (SAFOD); the pilot hole, to the left, has already been drilled; the planned hole crossing the fault passes through a region with frequent minor earthquakes (purple dots); cores from this hole and instrumentation from within it will provide a wealth of new information (image courtesy of U. S. Geological Survey).
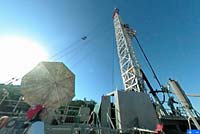
The rig that drilled the pilot hole in the SAFOD project (image courtesy of U. S. Geological Survey)
For the above reasons, Parkfield was predicted to be a likely location for an earthquake and was heavily instrumented in the late 1970s to take data before, during, and after this anticipated event. Ongoing observations include ground level, seismic activity, groundwater levels, electrical resistivity, heat flow, and geomagnetism. The instrument array includes thirteen seismometers located in boreholes, at depths of about 200 meters, to better detect micro-earthquakes.
Once data had accumulated, two geophysicists used the data and their models to forecast, with 95% confidence, that the next Parkfield earthquake would occur between 1985 and 1993. But it didn’t happen in this time interval and still hasn’t happened, highlighting the great difficulty of these predictions.
To take the Parkfield investigation to the next level, the USGS plans to drill to a depth of three kilometers, angling right through the fault itself, as shown in the drawing. Core samples will be taken all the way across the fault to provide a detailed picture of the geology at depth. Instruments, including seismographs and fluid pressure sensors, will be installed deep in the hole to provide ongoing measurements with greater sensitivity than was ever possible before.
A pilot hole, straight down for about two kilometers, was drilled in the summer of 2002, and planning is now proceeding for the deeper hole to the fault. Seismologists hope that this project will produce much greater understanding of earthquake warning signs and point the way to more accurate prediction in the future.
Links
United States Geological Survey
- The Parkfield Experiment
- The Great 1906 San Francisco Earthquake
- Prediction of San Francisco Bay Area Earthquake
- 3-D Display of Earthquakes at Parkside
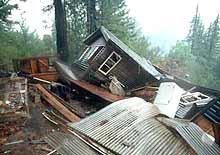
Damage from the 1989 Loma Prieta earthquake in California, also known as the “World Series quake” (image courtesy of the U. S. Geological Survey).
BBC


