FAST: Earthquake Analysis
When a nuclear test is conducted, data from around the globe charting the ground’s movement gets analyzed. These blasts have a specific signature, very different from earthquakes, and geologists can pick them out well. During these times, geologists get a bit of attention from news outlets, as they did near the beginning of this year when North Korea reported that they had tested a hydrogen bomb. In all the excitement, however, one thing that flew largely under the radar is a fantastic new method for sampling seismographic data to quickly detect earthquakes. This new method is called FAST, which stands for Fingerprint And Similarity Thresholding. It’s not necessary for analyzing explosions, but it might be utilized in the future to provide information on blasts, and it certainly is making headway with other seismic activity.
Moving Earth
When the ground moves, everything attached to it moves too. During earthquakes, there are two distinct wave types: body waves, which travel through the ground, and surface waves that—as you might have guessed—travel on the surface.
Body waves are composed of very fast moving longitudinal (also called compression) “P waves”, which are the first to reach seismometers. Longitudinal waves compress and expand the material along the direction that the wave is traveling in, as shown below.
The second wave to reach seismometers is an S wave, which is a transverse body wave. Transverse waves displace material perpendicular to the direction that the wave travels in, as shown. S waves are unable to travel through liquids, and are what provides evidence that Earth’s core has a liquid portion.
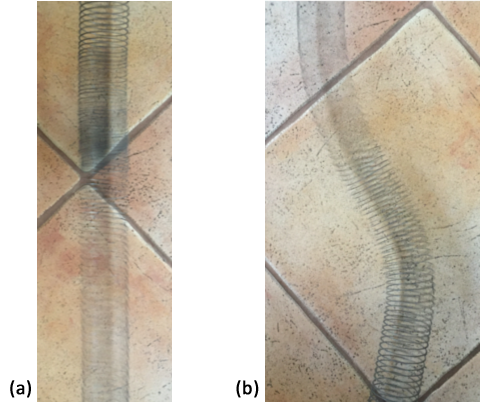
(a) Longitudinal wave on a slinky. (b) Transverse wave on a slinky.
Surface waves are the next to reach seismometers. These waves are responsible for the damage caused by earthquakes. Again there are two types, and these are called Rayleigh and Love waves. Rayleigh waves are similar to water waves, having both transverse and longitudinal properties, and Love waves are purely transverse waves. Love waves would be felt as the ground shifting side-to-side under you, while Rayleigh waves would give the sensation of rolling up and down.
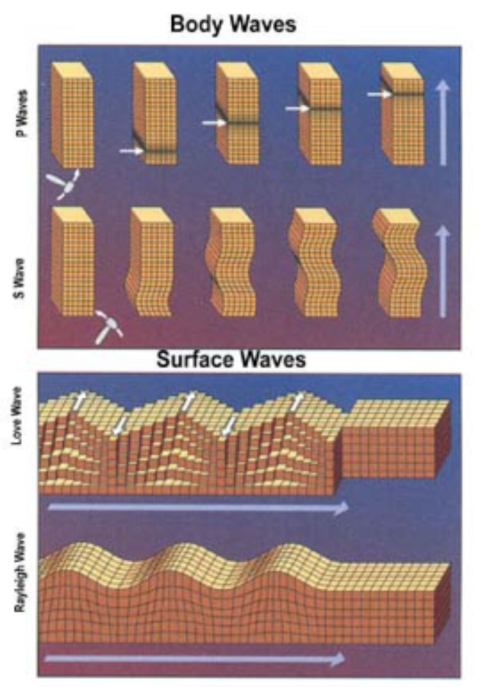
Image Credit: USGS
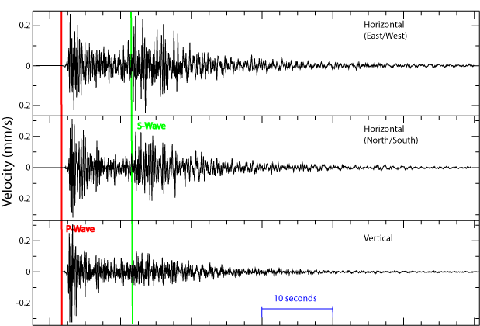
Image Credit: Wikimedia Commons
Seismometers
Seismometers are the instruments bolted to the ground that detect the ground’s motion. They work on the basis of Newton’s first law, which states that an object does not change its speed and /or direction unless there is an overall external push or pull on it. Therefore, if an object is at rest it stays at rest unless there is an overall push or pull on it. The older seismometers have a suspended pen that tends to stay at rest as the machine with paper (bolted to the ground below it), moves with the ground during an earthquake. In the image below it is the paper moving under a stationary pen that causes the lines shown.
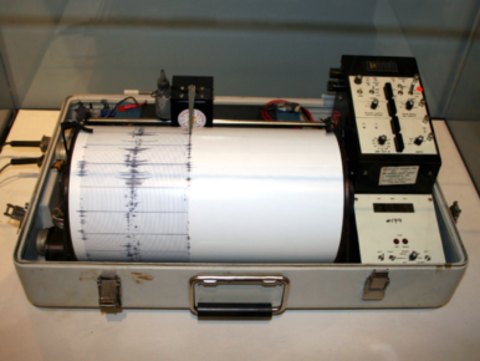
Image Credit: Wikimedia Commons
The new seismometers are different. They no longer use paper and pen to generate analog signals—instead, modern seismometers are digital and come in various types. Digital seismometers still work on the principles of Newton’s first law, but rather than a pen, they use a hanging mass.
The two main types are velocity transducers and force balance accelerometers (similar to what you’d find in a smartphone). For the velocity transducers, when the machine moves under the mass it causes a voltage change, which is recorded and translated to velocity or displacement in the north/south and east/west directions.
Force balance accelerometers measure the acceleration of the ground as it shakes. According to USGS4, “It uses a feedback system in which the output signal from the transducer is amplified and fed back to the device that moves the mass back to the unperturbed position."
For more on seismic waves, seismometers, and the latest earthquakes see: the Rapid Earthquake Viewer website and the United States Geological Survey’s (USGS) website!
All that data!
Digital seismometers offer many advantages over their pen-and-paper counterparts, the most important being that the data recorded by a digital seismometer can be continuously sent to a central processing station, reformatted and uploaded for all to use in a single format.3 This makes digital seismometers a valuable tool for capturing data on earthquakes both big and small.
The problem is that these digital systems generate a lot of data! Geologists need to sift through this data in a quick way, and their goal is threefold: high detectability of earthquakes, the ability to detect signals of varying type, and computational efficiency. Until recently, they have not been able to obtain all three.
When it comes to sifting through seismometer data, there are three popular algorithms: sliding averaging windows, matching templates, and autocorrelation. With sliding averaging windows, the amplitudes from the data are compared over a short time window and a longer time window. When the signal level in the shorter time window rises above a set value, it signals the start of an event. This is called a threshold value. When the signal goes above threshold many times over a short time interval, it may signal an earthquake. The sliding window algorithm is fast, and can be applied to a variety of geologic studies, but it lacks sensitivity, missing seismic activity near the background noise level.2
The second common method is template matching. Here, a signal of interest in the data is taken as a template and compared against other data to find similar signals. This method is computationally efficient and is very good at finding the signals of interest, but it does not have widespread applicability. That is, each template is very specific, requiring that you know what you are looking for ahead of time.
The third common method is called autocorrelation, and can be applied to a variety of geologic interests. Autocorrelation techniques can lead to new discoveries, but they are very computationally inefficient. In this method, a moving range of values tries to match similar data further along. Think of having templates for overlapping ranges of data, so you would try to match the data in the first 6 bins to values along your entire data stream. Then you slide your template to look at bins 3 through 9, this becomes your new template, and you compare it with all your data. The number of templates you have increases with the amount of data, and the number of regions compared against the template increases with the amount of data, making this one of the most time-consuming methods for investigating seismic activity.
The FAST method created by Dr. Beroza and his colleagues works much like information sampling software designed to figure out what song you are listening to, find duplicate webpages or copyright violations, and detect plagiarism.2 This algorithm goes through the data, transforms it, pulls out small samples of data that stand out, and grabs key features of the data so that all it holds is a binary fingerprint.1 An example is shown below:
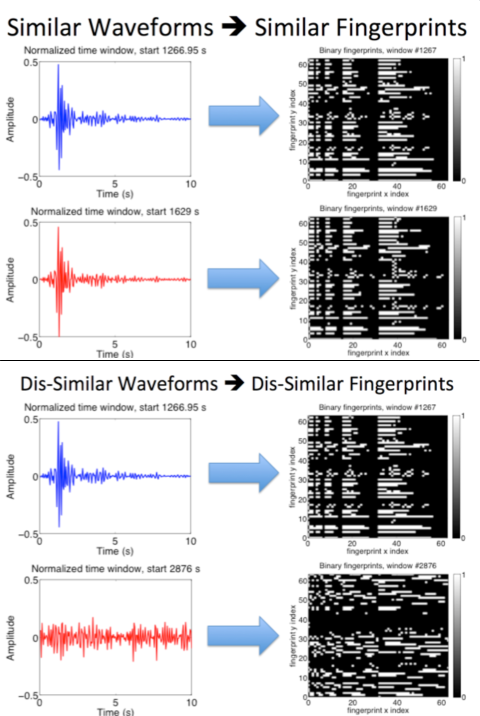
Image Credit: Greg Beroza, Stanford University
This method, as shown in reference 1, has been found to have high computational efficiency, high detection rates, and can be used to detect signals of various forms (generality) because it looks for similar waveforms by comparing everything with everything else in the data. This is unlike the template-based algorithm, which needs to know the waveform it’s trying to match before comparing it to the data.
When compared to autocorrelation methods, the FAST method can sift through one week of continuous data in 1 hour and 36 minutes. For the same data set, which contained 24 known seismic events, the autocorrelation method requires 9 days and 13 hours,1 making FAST—true to its name—143 times faster! In the performance comparison of FAST and the autocorrelation method, FAST exceeded expectations, detecting 68 new events that were not listed in the catalog of data. The autocorrelation method found 62 new events, some of which FAST missed—overall they found 43 similar new events. While the autocorrelation method found 19 events in the data that FAST overlooked, FAST did a better job of finding small-amplitude events, providing insight that may be used to better model aftershock behaviors.1 While it’s higher in sensitivity than other methods, it’s not as impressive when it comes to specificity: FAST did select 12 non-events that were just noise, but these were easily identified as such.
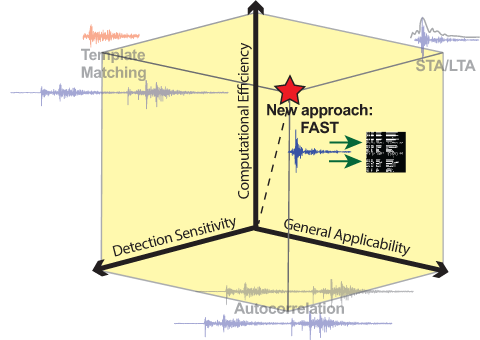
Image Credit: Greg Beroza, Stanford University
One feature of the system that may be considered a drawback by some is that the “fingerprints” are unique to each location of the seismometer—each seismometer's data has a special signature based on the surrounding rock. Since the surrounding features are different for each seismometer, the sampling of data to lift characteristic behavior from the full data set must be done for each seismometer. That may take some time, but once it is done, the signatures remain the same.
Future Research and Applications
The authors list identifying previously overlooked earthquakes as the most important advantage of FAST. Their work shows clearly that this FAST algorithm excels in being computationally efficient, precise, and adaptable. They do note, however, that they need to develop an extension of the algorithm to handle more information: so far the team has worked with a single data stream from a single seismometer. They state that, to be truly useful in detecting events near the background noise level, they need to use more than one data stream from each seismometer, and at least three stations.1 They are currently working on a multiple-station detection method, which should enhance the detection abilities of FAST as well. The researchers note that this technique could also be applied to real-time monitoring and future cataloging systems.
References and Resources
1. Yoon, C. E., et al., Earthquake detection through computationally efficient similarity search, Sci. Adv. 4 December 2015
2. Personal communications with Dr. Greg Beroza, Stanford University
3. United States Geological Survey (USGS)
http://earthquake.usgs.gov/learn/eqmonitoring/eq-mon-9.php
4. Rapid Earthquake Viewer
http://rev.seis.sc.edu/index.html
5. Northern California Earthquake Data Center, UC Berkeley
http://quake.geo.berkeley.edu/bdsn/bdsn.overview.html
6. Doss, H.M. Cloaking Earthquakes, Physics Central, Physics in Action 9 May 2013
http://www.physicscentral.com/explore/action/cloaking-earthquakes.cfm
—H.M. Doss


