Measuring Drought with GPS
December 8, 2014
A team of geologists serendipitously discovered a new use for the Global Positioning Satellite (GPS) system – measuring how much water is pushing down on Earth’s crust . What they found are some striking results that clearly show the western USAs drought, and correlate well with the data from the Gravity Recovery and Climate Experiment (GRACE) satellite system, and precipitation and waterflow data.
Serendipitous Data
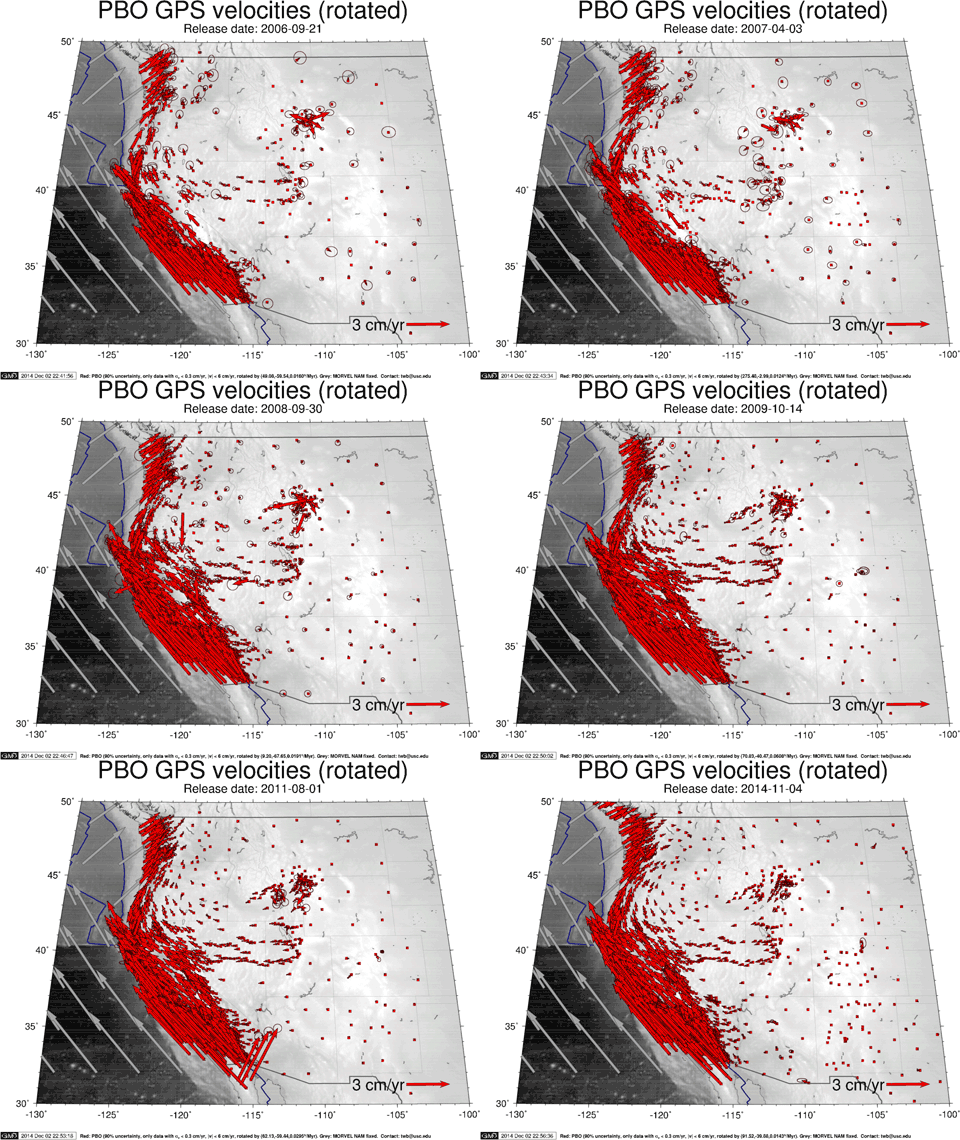
Many geologists studying movements of Earth’s crust are looking for movements due to tectonic or volcanic activity. The image below helps us visualize tectonic activity by showing with red arrows the slight movements of GPS stations. In particular, the image details the average velocities of GPS stations from September of 2006 through May of 2013 around the western US region.

Visualization of different generations of EarthScope Plate Boundary Observatory (PBO) network (consisting of over 1100 GPS stations, as well as other instruments) velocity solutions from UNAVCO using the Generic Mapping Tools (Wessel and Smith, 1989)
Image Credit: Thorsten W Becker, University of Southern California, Los Angeles.
This story begins with Dr. Adrian Borsa, one of the scientists involved in this serendipitous GPS study.1 While viewing data for a GPS station in Central California, Dr. Borsa noticed an unusual rise in station height at the end of 2012, which he regarded as probably being a malfunction with the GPS station.
The next GPS station he checked had the same height rise, as did the next. Intrigued, Dr. Borsa decided to map height changes for GPS stations in the western US, and found the same behavior at almost all the GPS stations.
Loads of Water
So what might cause this uniform rising of GPS stations? One explanation invokes the physical concept of loads.
Most materials have the ability to be compressed or stretched when a force is applied and return back to their original length or shape after the force is removed, provided that the force applied is not too large. This property is known as the elasticity of the material and the range of forces that can be applied to the material and still have the material go back to its original length (or shape) is known as the elastic region of the material.
The elasticity of a material is given by Young’s modulus, or the elastic modulus, which is defined as:

If the force is too large, it falls outside the elastic region and it will either permanently deform or break the object.
There can be other types of stress and strain on objects. Some are applied over the entire volume and some just parallel to surfaces (shear forces). Below are diagrams of compressive, and tensile stress, as well as shear stress. We will focus on compressive stress or compressive loads.

Compressive, tensile, and shear loading; isostatic pressure deformation.
Image Credits: Daniel M. Short/Life of Riley via Wikimedia Commons
Different materials have different values of Young’s modulus. For example aluminum has a young’s modulus of 70×109 newtons per square meter (N/m2) or 10,152,642 pounds per square inch (psi), and bone has about 15×109 N/m2 or 2,175,566 psi.
Even the Earth’s crust has its own Young’s modulus! Granite has a Young’s modulus of about 52×109 N/m2. One resource, (reference 2) calculates Earth’s lithosphere as having a young’s modulus of about 68×109 N/m2 or 9,862,566 psi.
Mother Earth's Load
When a force pushes down on Earth’s crust, Earth’s crust compresses and goes down in elevation. When forces no longer push down on Earth, it expands again. The most prevalent force or load pushing down on Earth’s crust is due to water.
Water is in all vegetation, in us, and in precipitation. Water is a load on Earth’s crust that can make it compress in a very appreciable, and measurable way. The depletion of water by evaporation and lack of rainfall causes a decompression on Earth’s crust causing it to expand in vertical height, going back to its uncompressed length.
But there is more than one mechanism causing Earth’s crust to lose vertical height. Imagine a porous region with a large aquifer that is being pumped and irrigated.
This depletion of water from below and sprinkling on top loses more water mass due to evaporation than it gains, and the porous ground gets compacted. Overall there is a decrease in volume and vertical height due to a decrease in porosity. This has been evident for decades in heavily pumped and irrigated areas such as in California’s Central Valley.1,2
So how much does water weigh? One cubic meter of liquid water at 3.98˚C or 39.16˚F and standard pressure is equal to 1000 kg or about 2025 lbs (1.1 US ton). As an example, consider the average yearly rainfall (over historical records) of about 12 inches (0.3048 m) for an area around San Diego in Southern California. A square meter of Earth in this region would have 304.8 kg of water precipitated on it, or 617.2 lbs pushing down on it each year.
Some of the precipitated water evaporates, however much of it is absorbed by plants and remains as part of Mother Earth’s compressive load. And not all of this weight falls at one instance on the land, but does so in cyclical spurts based on the seasons. Vegetative mass reflects an increase of compressive load over time.
If there is a dry season, the load is reduced, water evaporates, vegetation starts to die, and the compressive forces reduce. This elasticity of Earth’s crust has been known to scientists who study water on Earth for a while, but GPS data have not been used to their full extent to evaluate this phenomenon in the past.
Tying in GPS
Global Positioning Satellite (GPS) stations are anchored 10 meters down into the ground, or are on granite, and there are thousands of them across the US. Most of the GPS stations analyzed are part of a study on crustal deformation at the boundary between the North American and Pacific tectonic plates.
This project, called EarthScope, is one of the biggest Earth sciences projects ever funded by the National Science Foundation. The data from these GPS stations, as well as most US GPS stations, are available through UNAVCO4.

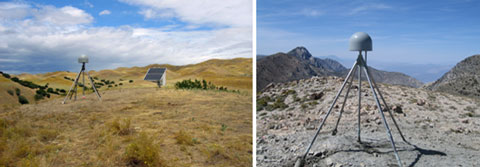
Two California GPS stations used in the determination of water loading changes in the western United States. The one on the left, Plate Boundary Observatory GPS station P298, is located along the central coastal region near Coalinga, California, The one on the right, P298, is mounted on a deep-drilled braced (Wyatt-Agnew) monument, above Death Valley, CA.
Image credit: Andre Basset, UNAVCO
The team of scientists, led by Borsa, used data from 771 GPS stations west of longitude 109˚W. This region includes California, Oregon, Washington, Idaho, Nevada, Arizona, Utah, and the western portions of Colorado, Montana, Wyoming and New Mexico. GPS systems in the Central Valley of CA, where large amounts of pumping and irrigation occur, were not included.
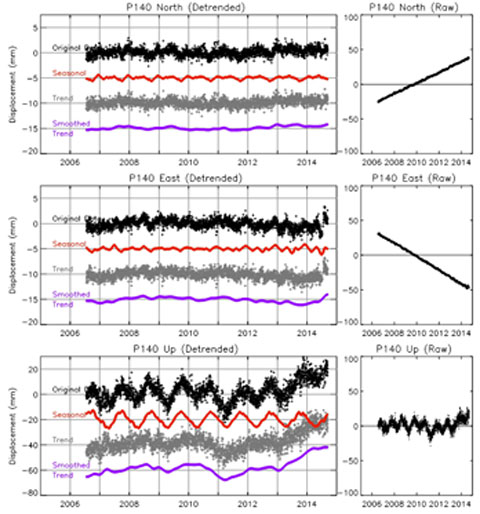
Displacements of these stations can be measured to within millimeters, and the cyclical weather patterns of loading and unloading of water on Earth are readily visible, as shown in the data below.
The top graphs detail the average North/South movement of a GPS station (called P140); the middle graph represents the average East/West movement of the station; and the bottom graphs represent the up/down displacement of the GPS station.
The left graphs have long-term trends removed. The original data for each graph (minus long term trends) is given in the top, black scatter plot, made up of average daily displacement values in millimeters, from mid-2006 through mid-2014. This data is typical for the 771 stations used in the research Borsa et al. presented in their research paper (reference 1).
The researchers applied a new technique to pull out seasonal cycles in the data, and then smoothed the remaining data to find an average trend line showing average, smoothed, displacement of the GPS station over time.
The small graphs on the right of each larger graph show the original data with the long-term trends included. The small graphs indicate that this GPS station is moving northward and westward, which fits with the tectonic plate movement, and it is also moving upward, but this upward trend is recent and correlates with the drought that hit the Western USA in 2013.

Original daily displacement data from one of the GPS stations, decomposition of seasonal data, and smoothed residual data. The small graphs on the right show the original data with the trend.
Image Credit: Adrian Borsa, Scripps Institute of Oceanography, University of California San Deigo.
Data from most of the 771 GPS stations show uplift due to unloading of the Earth’s surface, which the researchers attribute to loss of water from the current drought. The largest uplift occurs in the central Sierra Nevada, where water loss is estimated to be up to 50 cm (about 19.7 inches)!
The smallest uplift occurs in desert regions, where there is little water loading to begin with. Their analysis suggests that the amount of water lost since the beginning of the drought is about 240 gigatons or about 4.8×10¹⁴ lbs (2.18 × 10¹⁴ kg). This is equivalent to a layer of approximately 10 cm (almost 4 inches) of water across the entire western USA.
Corroborating the Data
Changes in precipitation create significant changes not only in the water load on Earth’s crust, but also in the mass at the surface and hence the gravitational pull. Scientists can study Earth’s gravitational field strength with the Gravity Recovery and Climate Experiment (GRACE) satellite system.
This experiment consists of two satellites, one trailing a bit behind the other, that follow the same path. They send signals to each other, and to Global Positioning Satellites, to determine incremental changes in their location that can be used to determine the gravitational pull of Earth. These satellites have been able to measure an appreciable change in the gravitational pull over the western part of the US due to the loss of water mass, (as well as other interesting shifts in Earth’s water systems).3
The researchers compared their data with the gravitational data collected by the Gravity Recovery and Climate Experiment (GRACE) satellite system, and precipitation and waterflow data, and all data sources show a large decrease of water in the western United States. The results show that the existing network of GPS stations can be used to study changes in water loads to a high degree of accuracy and reliability, and can be used to study long-term effects of regional climate changes.
Below are images showing GPS vertical displacement data across the United States. The top image of May 2011, shows subsidence in the western USA due to heavy precipitation that year for May 2011, the bottom image for May 2014 shows uplift due to the drought.
Vertical displacement data of GPS stations around the United States. The top image shows data for a year in which heavy precipitation occurred in the west (March 2011) and on the bottom during a drought year (March 2014).
Image Credit: Adrian Borsa, Scripps Institute of Oceanography, University of California San Diego.
The researchers’ article, published in Science,1 shows map images of every March from 2011 to 2014 for vertical displacements of the GPS stations, the annual precipitation, and maps of estimated loads and predicted displacements. The images can be viewed through this link: WUSA images/Science.
What's Next?
The researchers’ next steps will be to expand their analysis back in time to map out the change in load due to wet periods (such as 2011) and to the rest of the United States and beyond. They would also like to make their data available to water resource managers to help them understand changes in groundwater storage due to seasonal and longer-term trends in precipitation.
References and Resources
1. Borsa, A.A., Agnew, D.C., and Cayan, D.R., Ongoing drought-induced uplift in the western United States, Science (345)1587-1589 (2014).http://www.lpi.usra.edu/pss/sep2014/Senior-Review-2014-Report.pdf
2. Holzer, T.H., Elastic Expansion of Lithosphere Caused by Groundwater Depletion, J. Geophys. Res. (84) 4689-4698 (1979).
3. Gravity Recovery and Climate Experiment (GRACE) satellite system, NASA
http://www.nasa.gov/mission_pages/Grace/#.VGkjGocqN1I
4. UNAVCO (GPS DATA)
http://www.unavco.org
—H.M. Doss


