Blowin' in the Wind
About Hurricane Formation
After crossing Florida, Hurricane Katrina headed into the Gulf of Mexico early on August 26, 2005 as a Category One hurricane. Just 55 hours later it was a Category Five, packing wind speeds up to 175 miles/hour, with the Gulf Coast in its sights. How could this happen so fast? To better understand these storms, meteorologists have made the intensification of hurricanes a major focus of their research.
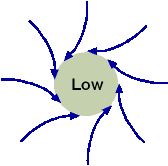
Air from surrounding regions flows into a region of low pressure. In the northern hemisphere, the Coriolis force curves winds to the right, as shown, producing the characteristic counterclockwise rotation of a low pressure area.
Adapted from a drawing in "Getting Around the Coriolis Force" by Dave Van Domelen, Kansas State University
Hurricanes are born in a concentration of tropical thunderstorms that forms an area of low pressure, with winds blowing in from surrounding areas. The Coriolis force (see sidebar), a so-called “fictitious” force that is a consequence of Earth’s rotation, curves these winds into a rotating system that spins counterclockwise in the northern hemisphere, as shown in the drawing, and clockwise in the southern hemisphere.
Hurricanes get their energy from the latent heat of water, the hefty 2500 kilojoules/kilogram released upon condensation of water vapor (the release of the energy needed to evaporate the water). The image shows Katrina over the warm waters of the Gulf of Mexico, which, as the colors indicate, was warmer than the Atlantic at this time.
A powerful feedback process can contribute to rapid hurricane intensification. As the spinning low pressure area moves over warm water, seawater evaporates and the warm, humid air rises, expands, and cools, condensing water vapor and releasing its heat of vaporization, making the air rise further. This rising air lowers the pressure and increases the surface winds, which in turn speeds up the evaporation from the sea surface. It is this cycle that enables the hurricane to gain strength so rapidly. To prevent tearing apart the developing storm as the warm air rises, wind shear—different horizontal wind speeds and directions at different altitudes—must be small.
Beyond the latent heat of water, mentioned above, its large specific heat—the amount of heat needed to raise a gram of water one degree centigrade—plays a role too. As the hurricane forms, the energy to evaporate the seawater comes out of the water itself. Since removing a given quantity of heat from a given mass of water produces a relatively small temperature decrease, the large specific heat minimizes the evaporative cooling.
Also, the winds in the hurricane have angular momentum, like a spinning ice skater. As these winds are sucked in toward the eyewall, decreasing their distance from the axis of rotation (see drawing), they speed up due to the conservation of angular momentum—like spinning ice skaters who draws in their arms to spin faster—thus intensifying the hurricane.
So putting it all together, hurricane development requires:
- Warm water (tropical latitudes, but see Coriolis force)
- Concentration of thunderstorm activity
- Humid air
- Small wind shear
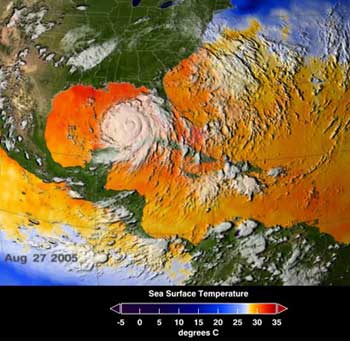
Hurricane Katrina over the Gulf of Mexico: Colors correspond to three-day averages of sea surface temperatures; note that the Gulf was warmer than the Atlantic. (image courtesy of NASA/SVS)
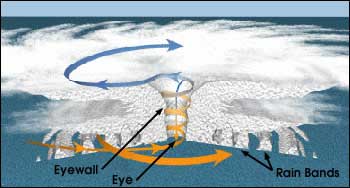
Wind spiraling in towards the eyewall of the hurricane. The conservation of angular momentum requires that the wind speed increase as the wind’s distance from the center of the storm decreases. Also, note how the air spirals upward in the eyewall. (image courtesy of NOAA)
Coriolis Force
The Coriolis force is a “fictitious” force, unrelated to interactions between particles or between particles and radiation. The Coriolis force is included in Newton’s Second Law (F=ma) to account for the acceleration of Earth’s frame of reference. (Another example of a “fictitious” force is the force you feel pushing you outward when you are riding in a car speeding around a curve.)
As Earth turns, the ground, and the air above it, has an easterly component of velocity due to the angular velocity of the surface (see diagram). This easterly component is an initial velocity for moving objects. In the northern hemisphere, wind blowing from south to north has the same initial velocity as the ground initially beneath it, but as it moves north, the ground beneath has less easterly angular velocity (the distance to Earth’s axis is less), so the wind curves to the right. In the same way, winds blowing from north to south in the northern hemisphere curve to the left. Although it’s not obvious, objects moving to the east or west experience the Coriolis force too—to learn more, see the first Link.
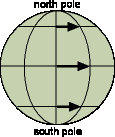
The arrows show the initial velocities of objects moving through the atmosphere, and of the ground as well, at the equator and a location in the northern and southern hemispheres. Since an object moving north from the equator has a larger initial eastward velocity than the ground to the north of it, the object will curve to the right in the Earth frame of reference. An object moving south from the equator will curve to the left.
Adapted from a drawing in “Getting Around the Coriolis Force” by Dave Van Domelen, Kansas State University
The Coriolis force is also responsible for bending the paths of hurricanes, typhoons and cyclones in opposite directions in the northern and southern hemispheres, as shown on the map. Note from the map that these storms do not form at the Equator, because the Coriolis force there has no horizontal component.
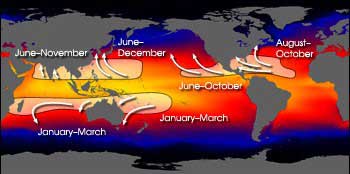
Curvature of the tracks of hurricanes, typhoons, and cyclones worldwide shows the opposite effect of the Coriolis force in the Northern and Southern hemisphere (image courtesy of SSAI/NASA-GSFC and Hal Pierce)
Research
One NASA research program in hurricane intensification utilizes data from the Tropical Rainfall Measuring Mission (TRMM) satellite, whose on-board radar can see all the way into the hurricane and make images of the precipitation. One TRMM goal is to investigate “hot towers,” high rain clouds that reach up 15 kilometers (nine miles), at least to the top of the troposphere, the atmosphere’s lowest layer. These towers indicate areas of the storm where large amounts of latent heat are released from the condensation of water vapor. A group of these towers forming in a portion of the hurricane’s eyewall are sometimes referred to as a “convective burst,” because of their vivid appearance in satellite data.
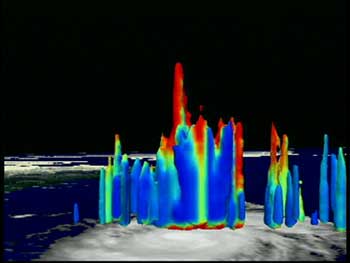
Hot towers in Hurricane Bonnie, 1998, as imaged by TRMM. The tallest tower here was 18 km (59,000 feet) high, about twice the cruising altitude of a jetliner (Please note that the relative height of the towers has been exaggerated.). The appearance of hot towers is believed to indicate that the hurricane is about to intensify. (image courtesy of NASA
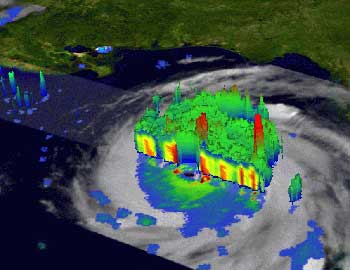
Hot towers in Katrina, as imaged by TRMM. (image courtesy of Hal Pierce-SSAI/NASA GSFC)
Hot towers are associated with intensification of hurricanes. The TRMM image shows hot towers in hurricane Bonnie, a Category Three hurricane responsible for about one billion dollars of damage when it struck North Carolina in 1998. An especially tall hot tower appeared in Bonnie just as it grew stronger, presumably because Bonnie’s slow speed at the time enabled it to absorb large quantities of heat from the warm ocean water.
And in Katrina, the TRMM radar observed several hot towers (second image). One of these, near the eye wall, was 16 kilometers (ten miles) high, and shortly after TRMM captured this image, Katrina moved up to become a Category 4 storm.
In a very different approach to investigating hot towers, the Convection and Moisture Experiment (CAMEX), conducted by NASA and NOAA, investigates intensity change by flying aircraft into the hurricane and observing the eyewall. The photos show the two kinds of aircraft that fly CAMEX missions, ER-2, a version of the U-2 spyplane, and the DC-8. These two planes observe hurricanes from much higher altitudes than have any previous aircraft.
In hurricane Bonnie, the ER-2’s radar provided much higher resolution than was possible from satellites. The data showed evidence of hot towers when Bonnie intensified, as did radar images from satellites, and moreover the aircraft-bound radar detected strong sinking air currents in Bonnie’s eye at this time. Sinking air in hurricanes had been observed before, but the ER-2 radar images showed just how dramatic this sinking can be in the neighborhood of an unusually large hot tower. Now meteorologists speculate that the sinking is linked to an increase in the temperature of the hurricane’s core, which can be observed with satellite images.
There are other approaches to studying hurricane intensification. For instance, some oceanographers believe that, beyond the temperature at the sea surface, the vertical thermal structure of the ocean could play a role, since the ocean is considerably churned by the passage of the hurricane. The Gulf Stream, a powerful current that originates in the Gulf of Mexico and flows well out into the Atlantic, can meander in the Gulf and then pinch off to form a ring, with depths of several kilometers and radii of more than one hundred kilometers. These rings could inject large amounts of energy into a developing storm in a very short time.


The DC-8 (top) and the ER-2, the two aircraft flown in the CAMEX project (images courtesy of NASA)
Links
Ohio State University
Science Magazine Online
National Geographic News
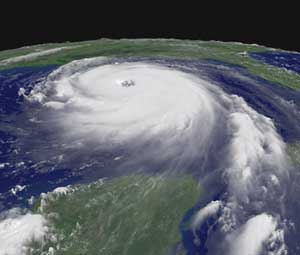
Hurricane Katrina over the Gulf of Mexico (image courtesy of NOAA)
NASA
- Hurricanes: The Greatest Storms on Earth
- Hurricane Multimedia Gallery [don’t miss the first animation]
- Looking at Earth
Scientific American, October, 2001


