Ice Ages
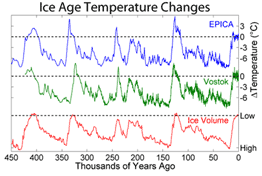
In the controversy over global warming, some people have suggested that human-induced warming might be a good thing if it kept us out of the next Ice Age. Here are some related data--the graph below shows how Earth's temperature has changed over the last half million years, and also how the ice volume has changed. Note that as the temperature goes up, the ice volume goes down, as expected.

Temperature changes over the last 450,000 years, from oxygen isotope ratios in ice cores; note the periodicity of approximately 100,000 years in the brief "interglacials;" (image credit: Global Warming Art; data is from Petit, J.R., et al., Nature 399: 429-436)
In this graph, time moves backwards to the left, and the zero of temperature changes corresponds to the present day. The blue and green lines show temperature determinations from two different Antarctic ice cores. These temperatures are determined from oxygen-16 and oxygen-18 ratios in ice cores (see Sidebar below).
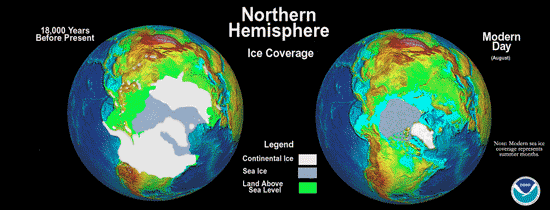
Note the rapid increase of temperature as Earth emerges from each of the four ice ages shown, and how regularly--about every 100,000 years--these rapid rises occur. Also, note the short duration of the interglacials (the periods in between the ice ages)--and we are fortunate to be living in one now. During the most recent ice age, up to 32% of Earth's surface was covered. (See image of polar ice)

Ice coverage in the Northern Hemisphere, 18,000 years ago and present-day (image credit: Mark McCaffrey NGDC/NOAA)
The abrupt ending of these ice ages suggests powerful feedback mechanisms. Here are two possibilities:
- Some warming melts part of the glaciers, exposing rock and dirt, which absorbs far more radiation than the highly reflective surface of ice, leading to more warming.
- Some warming drives carbon dioxide out of solution in the oceans, and this carbon dioxide can lead to warming through the greenhouse effect.
Backing up considerably further, the graph below shows the temperature record for about the last 5.5 million years. Note that in this graph, going back in time is to the right, and the zero of temperature changes corresponds approximately to the present day. Cycles of 100,000 years and 41,000 years are labeled. This graph was obtained from ratios of oxygen-16 to oxygen-18 concentrations in sediment cores.

Ice coverage in the Northern Hemisphere, 18,000 years ago and present-day (image credit: Mark McCaffrey NGDC/NOAA)
Research
To investigate the cycles of the ice ages, the Serbian scientist Milutin Milankovitch, building upon previous work in this field, determined the interaction of cycles in Earth's motion around the sun.
- The orientation of Earth's axis changes over time -- it moves in a circle around a fixed direction in space every 26,000 years, an effect known as the precession of the equinoxes-- this corresponds to periodic motion of the equinoxes around Earth's orbit (see drawing).
- In addition to the precession of the equinoxes, Earth's orbit shifts over time. The orbit is an ellipse, and the perihelion--the point of closest approach—slowly changes its position in Earth’s orbit.
- The combination of the above two effects produces a 21,000 year cycle of the motion of the equinoxes around Earth's orbit. (see drawing)
- An ellipse is characterized by its eccentricity--how much its departs from a circle. Earth's orbit is only approximately circular, and its eccentricity goes through a cycle with a period of 100,000 years. A larger eccentricity means a larger variation in the amount of sunlight striking Earth over the course of a year. (see drawing)
- Also, the tilt of Earth's axis swings back and forth by a few degrees on either side of the current value of about 23.4 degrees, with a period of 41,000 years. When the tilt increases, the seasonal differences become greater. (see drawing)
Milankovitch believed that the above cycles would specify time periods of high and low solar intensity on Earth's surface that would determine the ice ages, and he believed the critical times were the summer and winter solstices. A solstice occurs when Earth's axis has swung as far as far as possible towards or away from the sun. When the summer solstice occurs at the perihelion (point of closest approach), the intensity of sunlight striking the Northern Hemisphere reaches its maximum.
Moreover, he reasoned that, since there were large land masses near the poles, the critical seasons were summer and winter at large latitudes. Summer warming at the North Pole might melt more ice than would refreeze during the following winter, resulting in retreat of glaciers and increased absorption of solar radiation from the exposed land, which in turn would melt more ice.

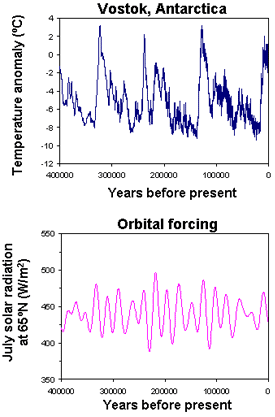
The last 400,000 years of temperature changes, and the "forcing" from changes in the intensity of sunlight striking Earth’s surface. (Image credit: NOAA/NCDC; data is from Berger, A. and Loutre, M.F., Quaternary Science Reviews 10: 297-317 and Petit, J.R, et al., Nature 387: 359-360)
The lower graph below shows the summer radiation at high latitudes calculated according to this theory, with the corresponding temperatures shown above on the same graph. An approximately 100,000 year cycle does appear in the radiation, but the effect is not large.
In the 1990s, a competing theory appeared, based on another 100,000 year cycle-- the swinging of the tilt of Earth's orbit in and out of the plane of the solar system. This motion, with a range of about 2.5°, carries Earth in and out of regions with more interplanetary dust, which could scatter sunlight and produce a cycle of ice ages. This new theory forced a reappraisal of the methods of dating ice cores, and the controversy is ongoing. Quite possibly the warming effects of carbon dioxide in the atmosphere, and also the exchange of heat with the oceans, will be part of the answer.
And how might global warming affect the timing of the next Ice Age? In the early 1970s climatologists believed that the current interglacial would soon end, but more recent work indicates the opposite. For the next 100,000 years, very little change is expected in the amount of solar radiation reaching Earth, partly because the eccentricity of Earth's orbit will remain small during this time. And when the increasing concentration of carbon dioxide in the atmosphere is considered, the current interglacial could be quite long indeed. Writing in Science, A. Berger and M. F. Loutre state, "Most model studies to date confirm that the pattern and range of global climactic conditions likely to be experienced in the future will be close to those during the warmest phases of the last few tens of millions of years." (Science 297 pp. 1287-1288)
Links
NOAA/NCDC
NASA: Earth Observatory

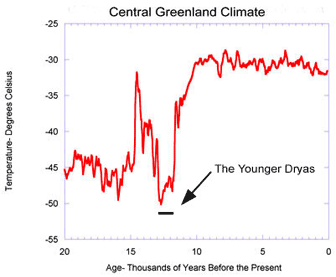
This is an example of abrupt climate change, as Earth was emerging from the last ice age. (NCDC/NOAAl; data is from
Cuffey, K.M. and Clow, G.D.,,Journal of Geophysical Research 102: 26383-26396 and Alley, R.B., Quaternary Science Reviews 19: 213-226.)
U.S. Naval Observatory
University of California Riverside
Lawrence Berkeley National Laboratory
Center for History of Physics


