Imaging Forests for Environmental Assessments
March 27, 2017
Recently, an airborne observatory utilizing LiDAR (Light Detection and Ranging) and a Visible-to-Shortwave Infrared (VSWIR) imaging spectrometer were used to map and measure the health of 720 billion square meters of forest canopy in South America. Utilizing measurements made by the airborne observatory, along with data from ground and satellite observations, scientists were able to gain an understanding of the biosphere and conclude how underlying human and environmental controls affect it, providing new insights into how to conserve biodiversity with the effects of land use and climate change.1
Spectroscopy
Radio waves, microwaves, visible light, ultraviolet light, X-rays, and gamma rays are all types of electromagnetic waves. All electromagnetic waves travel through empty space at the same speed, 300,000,000 m/s, which is roughly the same as the speed of light in air. More energetic electromagnetic waves have higher frequencies and shorter wavelengths—for example, violet and blue light have higher frequencies, shorter wavelengths, and carry more energy per photon (packet of electromagnetic energy) than red and infrared light.
Spectroscopy involves measuring light absorbed or emitted by something. Each element has its own special spectral fingerprint. For example, when hydrogen gas has a high voltage placed across it, its electrons are bumped up to higher energy levels. When the electron goes back down to lower energy levels, it emits light that has an energy equal to the energy difference between the level it started at and the one it ended at. The electron of a hydrogen atom has very distinct distances from the nucleus where it is allowed to be located, which results in this light having very distinct energies and colors. Because of this, the hydrogen atom emits light of a specific frequency when the electron goes from a high-energy state to a lower one. This process is called emission spectroscopy.
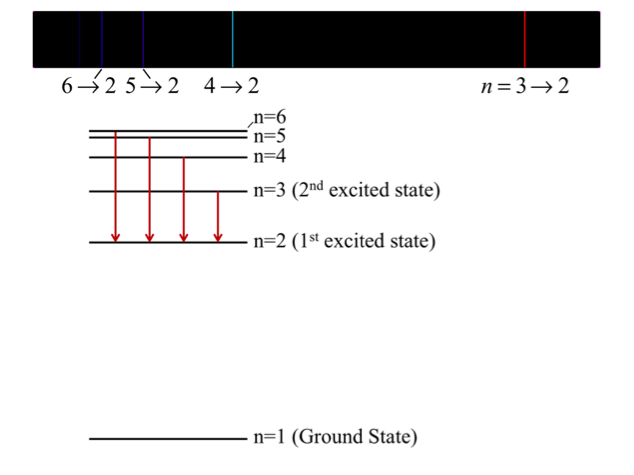
Image Credit: R. Pogge, Ohio State University Astronomy
In contrast, absorption spectroscopy involves shining a broad energy range of electromagnetic radiation—such as visible light or infrared light—on an object, then measuring which energies are absorbed by the object. These energies are the same as those that would be emitted. The difference is that our hydrogen atom example now has its electron absorb a specific energy of light as it goes from a lower state to a higher state. The light of this energy corresponds to a distinct frequency and wavelength. Below is an image of the visible absorption spectrum for hydrogen gas.
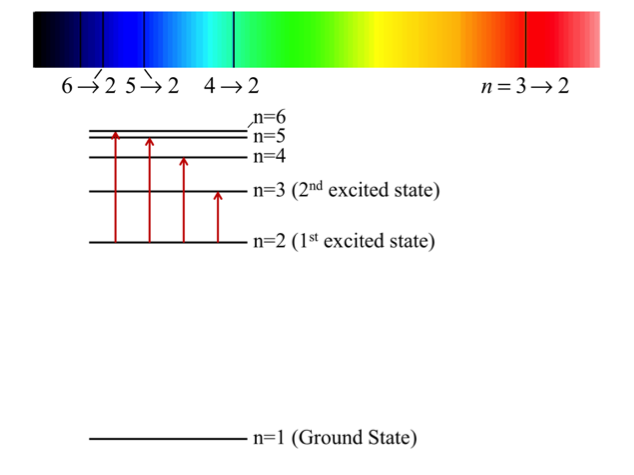
Image Credit: R. Pogge, Ohio State University
The dark lines in the absorption image have the same frequency as the bright lines in the emission spectrum. Furthermore, the absorption and emission spectrum is unique for each element—it is a characteristic property and acts like a fingerprint for each element. Molecules have distinct absorption lines as well, but they’re more complex than the lines of their component atoms.
When we look at sunlight and see what light from the Sun is absorbed before it reaches Earth, it allows us to determine what elements are in the Sun’s outer atmosphere. This is part of how we know what stars like our Sun are made of.
Similarly, we could look at the light passing through our atmosphere and determine key components of our atmosphere, or ambient light reflected off of a forest canopy to learn something about the forest canopy.
Forest Canopy Spectroscopy with the Carnegie Airborne Observatory (CAO)
The Carnegie Airborne Observatory is able to probe structure, function, and composition of ecosystems by utilizing its onboard instruments, but it can also combine the data it collects with other databases to provide information on the diversity of threatened areas, as described in a recent journal article by Asner et al.1
The Carnegie Airborne Observatory uses of a Visible-to-Shortwave-InfraRed- (VSWIR) spectrometer and a Light Detection And Ranging (LiDAR) scanner.
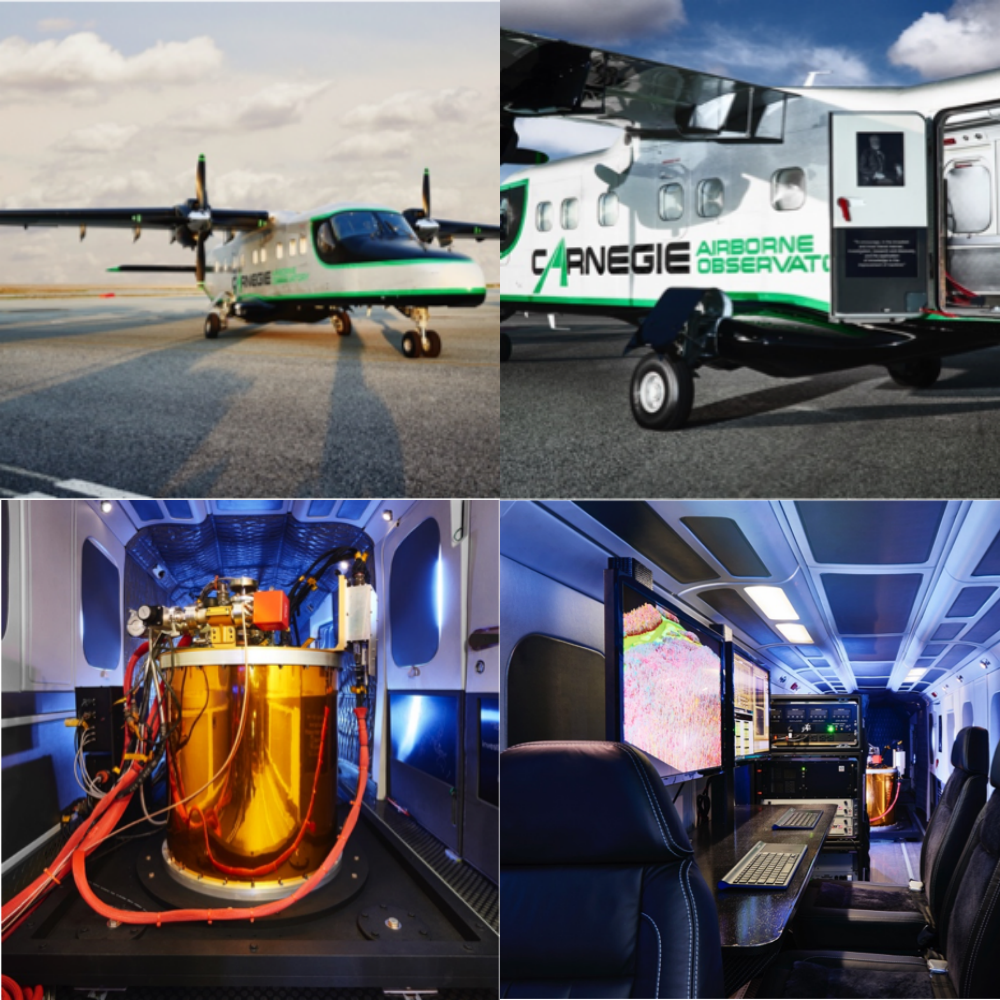
Image Credit: Gregory Asner, Carnegie Institution for Science
The input light source for the Visible-to-Short-Wave-InfraRed (VSWIR) spectrometer consists of the light reflected from the ground and forest canopy below the aircraft. The light is focused into the spectrometer, where it interacts with a diffraction grating, and then is redirected to a set of detectors. The detectors are kept uniform by an on-board calibrator, which uses a halogen source that allows the detectors to be fine-tuned by providing a known reference spectrum. Additionally, a helium-neon laser is used to confirm the proper calibration of the spectrometer.2 This spectrometer is capable of resolving atmospheric aerosols (small particles) and water vapor, allowing the researchers to take these factors into account when determining the reflectance from the surface and vegetation.2
The Light Detection And Ranging (LiDAR) instrument has a two-laser scanning system, which is used to image the area below the observatory. When measuring elevation, it has an accuracy of 18 cm per 1000 m, and 15 cm per 1000 m for horizontal measurements. LiDAR works by sending a laser beam out and measuring the reflected beam and how long it took to return, and if at all it was shifted by striking a moving object. This information allows scientists to map any object it reflects from in great detail. Below is a a LiDAR image of the forest canopy with natural coloring taken by the research group.1 The second image overlays spectral data taken on the canopy. Each species of tree has its own special spectral signature.2,3
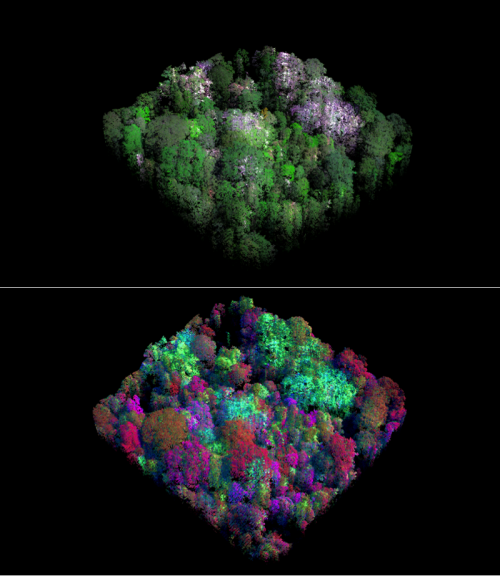
Image Credit: Gregory Asner, Carnegie Institution for Science
With these two highly specialized instruments, Asner and his fellow researchers were able to measure seven forest canopy traits important for understanding the health and diversity of a forest canopy: (1) Leaf Mass per Area (LMA), (2) Lignin, a chemical compound which provides structure in vascular plants, (3) nitrogen, (4) phosphorous, (5) Phenols, organic compounds with a hydroxyl group attached (6) Calcium, and (7) Water.
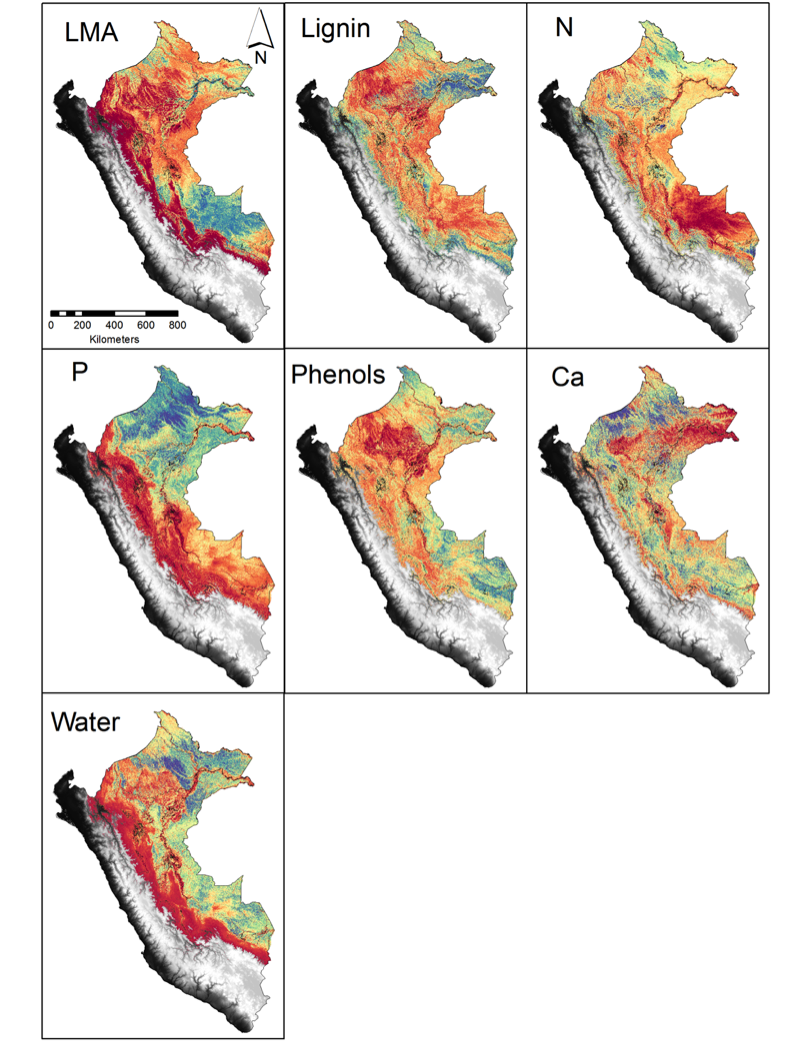
Image Credit: Gregory Asner, Carnegie Institution for Science
The researchers found some correlation between the seven traits measured, which they expected, but none was strong enough to clearly delineate specific regions, biodiversity, or health of the canopy. However, when the scientists took into account environmental factors, they found that the underlying geology and elevation are the primary controls on the forest canopy traits, and the secondary dominant factors influencing the measured seven traits are slope, hydrology, and amount of sunlight striking the area.1 Combining all the information led the scientists to define 36 functional classes2 (types of forests3), which they were then able to reduce into 6 functional groups largely defined by topography and region, each with its own particular percentages of the seven traits.1
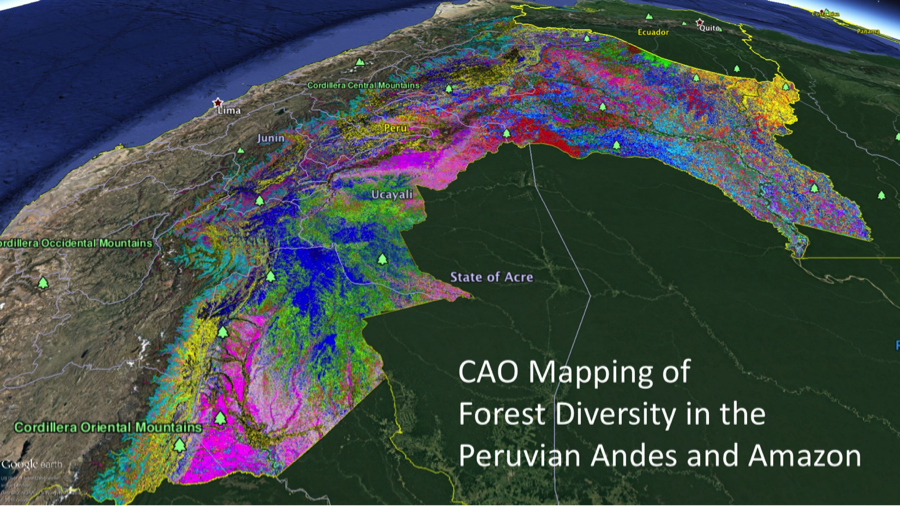
The researchers were able to assess the diversity of current protected regions, regions that were threatened (in particular regions where logging and petroleum industries are engaged), and regions that could be protected. The map that follows shows regions under current protection.
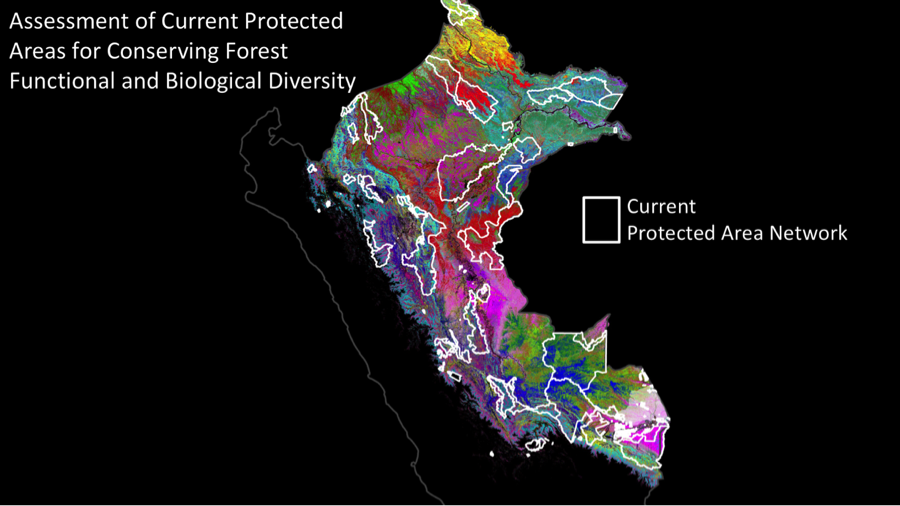
Image Credit: Gregory Asner, Carnegie Institution for Science
Future Research
This new understanding of the spectral components of different types of forests and how they relate to the biodiversity and overall health of the forest can be used to measure many different types of forests and give insights into how human activity and climate change affect forests. When asked, “What’s next?” Greg Asner replied, “I’m mapping Borneo and Ecuador, and also working on a satellite version of my airborne lab so I can take it global.”
References and Resources:
1. G.P. Asner, et al., Airborne laser-guided imaging spectroscopy to map forest trait diversity and guide conservation, Science 385, 385-389 (2017). http://science.sciencemag.org/content/355/6323/385.long
2. G.P. Asner, et al., Carnegie Airborne Observatory-2: Increasing science data dimensionality via high-fidelity multi-sensor fusion, Remote Sensing of Environment 124, 454-465 (2012).
3. L. Hamers, Mapping rainforest from the air reveals 36 types of forest, Science News, 14 Feb 2017 https://www.sciencenews.org/article/mapping-rainforest-chemistry-air-reveals-36-types-forest
—H.M. Doss


