Catch a Cosmic Microwave
A trio of recent findings on cosmic microwave background radiation lends strong support to the idea that the entire observable universe was once smaller than an atom and underwent a "super-charged" Big Bang. In an infinitesimal fraction of a second the entire universe experienced a mind-bogglingly vast expansion or "inflation." The findings are consistent with the way we see galaxies distributed across the cosmos. They are also consistent with the idea that everything we can see with telescopes—up to 14 billion light years away—is the tiniest fraction of a universe so large that it may in fact be infinite.
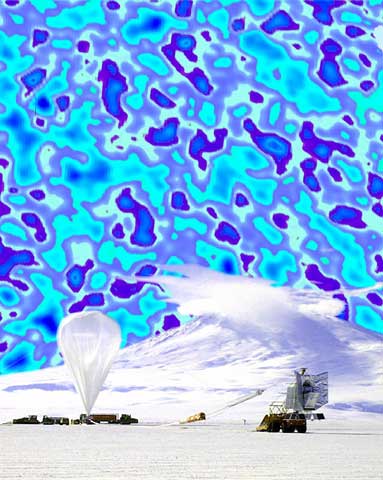
The CMB sky over Mt. Erebus. In this fanciful picture, the CMB sky looms behind the prelaunch preparations of BOOMERANG. The BOOMERANG images of the early universe have been overlaid onto the sky to indicate what size that the fluctuations would appear if a standard 35mm camera were sensitive to microwave light. The color map of the CMB images has been changed here to aesthetically match the rest of the picture. The CMB images and the prelaunch picture are available separately. Image courtesy of the BOOMERANG collaboration.
The Big Bang Theory is the well established idea that the universe originated about 14 billion years ago in an "explosion" from a single point of nearly infinite temperature and density. All the matter and energy that we can detect— from the tree you see outside your window to the furthest galaxy—was once compacted almost into a single point. Scientists first arrived at this theory when they observed that galaxies are flying apart from each other and that the farther the galaxy is from us, the faster it is moving away. They are flying apart because space itself is expanding. Running the clock backwards yields an age of about 14 billion years.
While this means the observable universe—that is, the part we can see through telescopes—extends 14 billion light years in every direction, it doesn't mean this is the total scope of the universe. The cosmic microwave background findings support the idea that the universe, in its entirety, is vastly larger. We just don't see it because the light from those objects further out has not had enough time to reach us yet. What happened, cosmologists now believe, is that in the first instant of its existence, the universe underwent "inflation" whereby space itself expanded so quickly and vastly that most of it was pushed beyond what we can see even today 14 billion years later.
The early universe was very hot and very dense with exotic particles—the predecessor to atoms and energy. As it expanded, it cooled. When the universe was about 400,000 years old, the temperature had cooled enough to allow ordinary atoms (chiefly hydrogen) to exist. It was then that there was hardly any interaction between the cosmic background radiation and matter. This radiation could then cool from about 4000 kelvins to its present temperature of only 2.74 kelvins (i.e. 2.74K above absolute zero). In terms of energy, this corresponds to a reduction from the visible light region to weak microwaves.
Here are a few milestones in the history of the universe:
| Time since the Big Bang | Temp | Contents of the universe |
| .01s | 1011 K | The universe is a mix of radiation and elementary particles. |
| 4 min | 108 K | Stable helium and hydrogen nuclei form. |
| 400,000 yrs | 103 K | Stable helium and hydrogen atoms form. |
“We've Been Scooped”
The Big Bang theory was first developed in the 1940s and even then predicted the existence of the microwave background. But only in the 1960s did a group of physicists at Princeton begin to search for it.
At about the same time, Arno Penzias and Robert Wilson, two radio astronomers at Bell Labs, began a study of the radio emissions from our galaxy. Their antenna is shown behind them in the photograph. At first, they were surprised to find persistent, unexplained noise in their antenna. The noise was independent of time of day, the season of the year, and the direction their antenna pointed. Without knowing it, Penzias and Wilson had discovered the microwave background! To help understand their observations, they called the leader of the Princeton group, Robert Dicke, who explained the source of the noise and then announced to his group, “We've been scooped.”
Penzias and Wilson received the Nobel Prize in 1978 for their discovery.
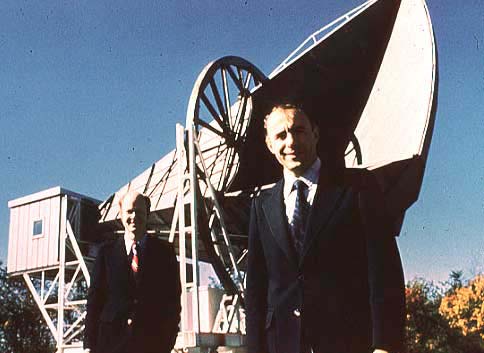
Arno Penzias and Robert Wilson, in front of their microwave antenna (photo courtesy of Lucent Technologies, Inc.)
Evidence for the Big Bang
Why do we believe in the Big Bang model? There are four main pieces of evidence:
- microwave background
- recession of the galaxies
- abundance of chemical elements
- irregularity of microwave background
Let's look at each one:
Microwave Background: The Big Bang theory predicts that space is bathed in weak microwave radiation. Such radiation was discovered in 1965 by Penzias and Wilson. Careful measurements of the intensity of this radiation over a large range of wavelengths matched the predictions to extraordinarily high accuracy.
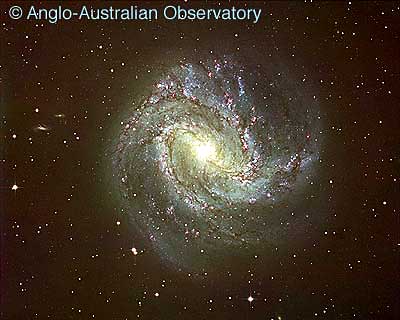
M83, a spiral galaxy about 15 million light years away and receding at about 330 km/sec (© Anglo-Australian Observatory)
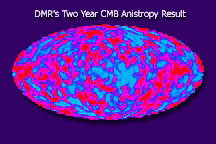 This image shows two years of accumulated data from the Cosmic Background Explorer (COBE) satellite. The different colors show tiny differences, about one part in a hundred thousand, between the temperature of the microwave background at different places in the sky. (image courtesy of NASA)
Recession of the Galaxies: Well before the Big Bang theory was proposed, the astronomer Edwin Hubble discovered that distant galaxies are MOVING AWAY from Earth with a recession velocity proportional to their distance. This observation established the expansion of the universe. The illustration shows a receding galaxy located about a thousandth of the way to the edge of the visible universe.
Abundance of Chemical Elements: Observations of spectral lines (see illustration) from distant galaxies show that the universe is about three-quarters hydrogen and one-quarter helium. This is just the ratio predicted from a Big Bang explosion that produced intense gamma radiation that inhibited the formation of elements beyond helium. As the universe expanded and cooled, this gamma radiation became the microwave background.
Irregularity of the Microwave Background: The way matter clumps together in stars and galaxies leads to the prediction that the intensity of the microwave background has tiny irregularities. The theory predicts that the background radiation has a blotchy pattern, with a characteristic size of half a degree (about the angular size of the moon) or less. The irregularities are only about one part out of one hundred thousand, but they have in fact been observed, as shown in the illustration of results from the Cosmic Background Explorer (COBE) probe.
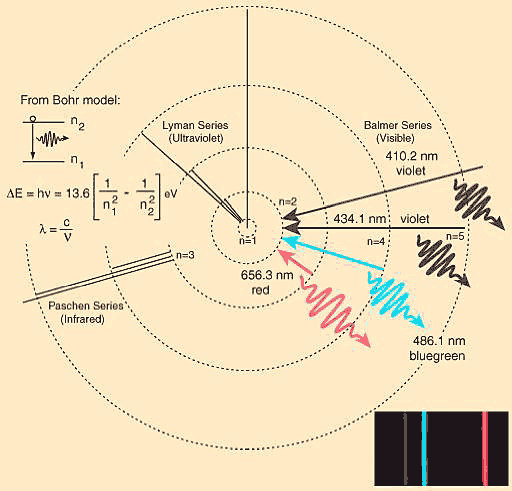
Light given off by excited hydrogen atoms, with wavelength increasing from left to right; note the separate lines, unlike the continuous pattern of colors in a rainbow; these lines are characteristic of hydrogen (image courtesy of HyperPhysics, © Rod Nave)
The New Cosmic Background Radiation Findings
By Richard M. Todaro
With special thanks to Dr. Paul L. Richards, Professor of Physics at the University of California, Berkeley for his kind and patient telephone tutorial on Big Bang cosmology.
A trio of findings about cosmic background radiation may help explain why matter is irregularly distributed throughout the universe with the observed “large-scale structure” of galactic super-clusters.
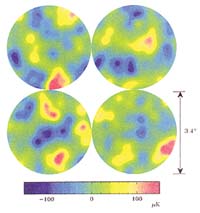
A sample of four false-color maps of intensity variations in the cosmic microwave background (CMB) from different parts of the sky created from data collected by the University of Chicago's Degree Angular Scale Interferometer (DASI). The maps depict tiny deviations, on the order of one hundred thousandth of one degree, in the otherwise uniform 2.73 K background. The maps are a snapshot of the universe as it looked 14 billion years ago. DASI is funded by the National Science Foundation. (Graphic courtesy of the DASI Collaboration)
While the existence of cosmic background radiation has been known since the 1960s, the variations in the radiation have only been known since 1991. In that year, NASA's Cosmic Background Explorer satellite first measured the slight variations in the cosmic background radiation, which can be measured as either variations in frequency/wavelength or in absolute temperature. (Absolute temperature is measured on something called the Kelvin scale. A temperature of 0 Kelvin defines the situation in which thermal motion ceases - it is never actually reached - and it corresponds to -273C.)
This past April, three teams of scientists presented their findings on variations in the cosmic background radiation at an American Physical Society conference in Washington, D.C. Each of the teams measured the cosmic background radiation in different parts of the sky and at somewhat different wavelengths. Two of the three teams had already presented preliminary findings on the largest variations in the background radiation last year.
The experiments are each known by their acronyms: DASI, BOOMERANG, and MAXIMA. The first stands for Degree Angular Scale Interferometer, and it used 13 distinct ground-based radio telescopes at the South Pole to measure cosmic background radiation frequencies in the low energy part of the electromagnetic spectrum (weak microwaves). The other two were both balloon-borne experiments that measured the cosmic background radiation at slightly higher frequencies in the millimeter region.
BOOMERANG, short for the Balloon Observations Of Millimetric Extragalactic Radiation ANd Geophysics, consisted of a very sensitive millimeter telescope that was carried aloft by a large balloon 120,000 feet or about 37 kilometers into the upper atmosphere over Antarctica. The balloon and its attached instruments circumnavigated the Antarctic continent over almost an 11 day period from late December 1998 to early January 1999, measuring the cosmic background radiation.
MAXIMA, the Millimeter Anistrophy eXperiment IMaging Array, also measured the background radiation in the millimeter region, but it flew for just a seven-hour period on the night of August 2, 1998 high above Texas.
The minute variations in the cosmic background radiation recorded by all three experiments are a very significant finding. Today's cosmic background radiation is a faint "echo" of the much more intense radiation that filled the universe several hundred thousand years after the Big Bang/inflation event when it had cooled just enough to permit ordinary (electrically neutral) matter to form. This radiation last interacted with matter when the matter in the universe was still a hot plasma of electrically charged particles. This occurred about 300,000 years after the Big Bang, or about 14 billion years ago. Thereafter, the universe cooled enough to allow ordinary matter (mostly hydrogen atoms) to form. That last interaction is called the “time of last scattering.”
Since then, this radiation has been moving in all directions across the universe (only very tiny bits of it intercepted by matter). The radiation has “cooled” over the age of the universe - roughly 14 billion years - from about 4,000 Kelvin at the time of last scattering to about 2.74 Kelvin, which falls in the microwave region of the electromagnetic spectrum. (By contrast, the Sun radiates most strongly in the visible light wavelength with a corresponding temperature of roughly 5,000 Kelvin.)
In these earlier findings, each had found that this cosmic background radiation alternates between “hot”and “cold” patches on the order of 50 millionths to 100 millionths of a Kelvin (i.e. 50 to 100 micro-Kelvins) and at a spatial separation of about a half a degree (which is about the size of the full moon as seen in the sky).
The refined findings by two of the teams combined with the new findings by a third team showed more detailed structure within the hot and cold patches. Much like a musical note as a fundamental “harmonic”, the new findings showed additional harmonics of hot and cold patches within larger hot and cold patches.
The analogy to sound waves is actually rather apt. In the early universe, before it cooled enough to allow ordinary matter to form and instead was a hot plasma (with negatively charged electrons moving too fast to be captured by positively charged protons), minor fluctuations in the plasma behaved like acoustic (sound) waves. Areas of compression in the plasma density corresponded to hotter patches and areas of expansion in the plasma density corresponded to colder patches. In this way, the cosmic background radiation that fills space today is a slowly fading echo of those sound waves that permeated the plasma.
These density fluctuations also allowed matter, once it had formed, to clump together. Without such fluctuations, matter could not have collected together and gravity could not have worked to further cluster more matter together. Ultimately, it allowed stars to form, which in turn allowed galaxies and clusters of galaxies and clusters of the clusters (called super-clusters) to form. What is referred to as "large-scale structure" in the cosmos, with matter showing a “lumpiness” in its distribution across the universe, arose from such fluctuations. The tiny hot and cold patches observed in the cosmic background radiation are not only the fading echoes of that awesome music of creation, they also suggest why stars and galaxies are arrayed as they are across the cosmos.
Download extended article in pdf format.
Links
NASA
- COBE (Cosmic Background Explorer) Educational Resources
- MAP (Microwave Anisotropy Probe) Education and Outreach
Cambridge University
University of California at Berkeley
Bell Labs
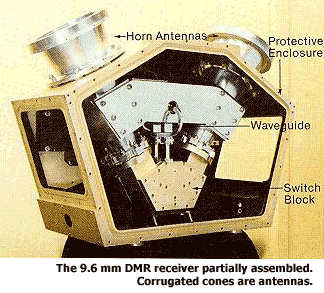
The microwave detector in the COBE satellite; this detector measured microwave intensity at 34 different frequencies. (photo courtesy of NASA)


