Deciphering Vesuvius Scrolls with "X-ray" Vision
March 2, 2015
When Vesuvius blew in 79 AD, it covered a small nearby town called Herculaneum in volcanic ash, rock, and lava. The eruption helped to preserve but also char an incredibly well-stocked (over 1800 volumes) family library in the city. Now scientists have discovered a potential way to reveal the message within these charred scrolls.
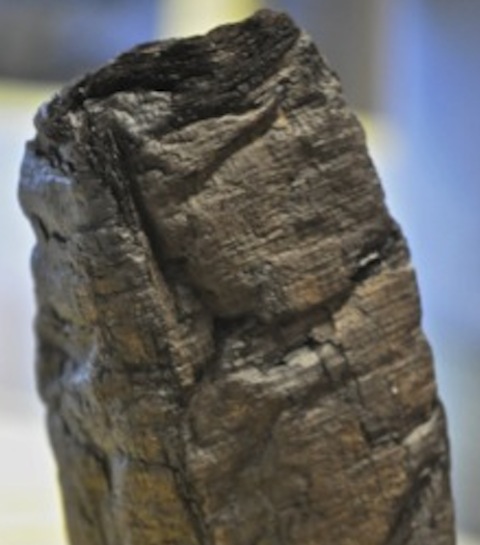
Close up view of the top 5 cm of Herculaneum Papyrus scroll PHerc.Paris.4.
Image Credit/Copyright: E. Brun
The library and its charred papyrus scrolls were discovered in 1759, and since that time researchers have made several attempts to read the scrolls with little success. Unfortunately hundreds of scrolls have been destroyed as historians, archeologists, and scientists tried to unroll them to access what is written on them.
Unrolling methods were continued until the 1980s, when researchers decided that too many scrolls were irretrievably damaged during the unrolling processes. Scientists put a moratorium on unrolling scrolls and waited for future gentler methods unknown to them.
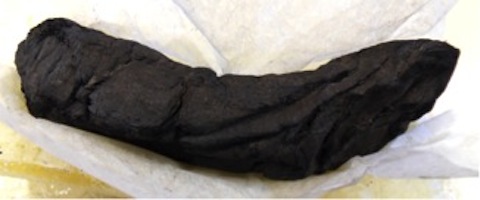
Photograph of the entire (16 cm in length) Herculaneum Papyrus scroll PHerc.Paris.4
Image Credit and Copyright: D. Delattre/Bibliothèque de l'Institut de France
Still, scientists had bits of already damaged scrolls to examine. Scientists have tried to image these bits of scrolls using various techniques, including X-rays. They discovered that the scrolls were written with carbonized ink (soot), and once the papyrus rolls were charred (carbonized) the ink was indistinguishable from the paper with most methods scientists tried.
Over the past 20 years it was determined from salvaged pieces of unrolled scrolls that the scrolls were Epicurean philosophical texts. Methods used to gather information on the bits included binocular microscopy: digital photography with filters to isolate a certain part of the infrared spectrum that helped determine ink from paper.
But these techniques could not be used on rolled up scrolls because they cannot penetrate the scrolls. X-rays can penetrate the scrolls, but the contrast between X-ray absorption of carbonized ink and carbonized papyri was not enough to image the ink characters within the rolled up scroll.
Then a new idea erupted - X-Ray Phase Contrast Tomography (XPCT). This technique uses the phase information of a wave to learn about the sample the waves are sent through.
The soot from the ink is layered on the papyrus, and comes about 0.0001 meters (a tenth of a millimeter or about 100 microns above the surface of the papyrus sheet. When the papyrus scroll charred, it became nearly indistinguishable from the ink, but did not change the fact that the “ink” was still atop the paper.
Dr. Vito Mocella had the idea of using X-ray phase contrast tomography to capitalize on slight differences in X-rays passing through papyrus and passing through ink, about 100 microns thicker, to image the scrolls, without even unrolling them! His first pass would be a proof of concept, and that is what his latest Nature article reveals.1
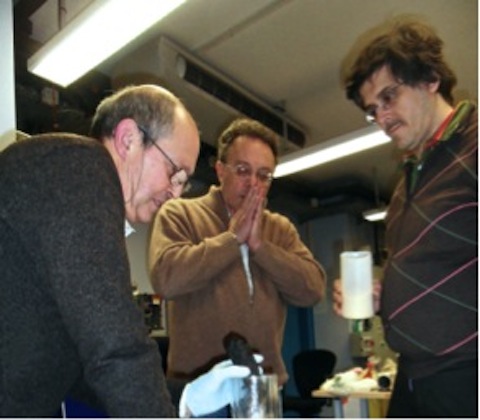
Photograph of the team during sample installation in the sample holder. From Left to right: D. Delattre, C. Ferrero, V. Mocella.
Image Credit: J. Delattre
Phase and Phase Contrast
Let’s review waves for a moment. Waves have multiple parts: their amplitude (how high and how low do they go), wavelength (the distance before they start repeating themselves), frequency (how many repeats go by each second), and speed (how fast is the overall wave going).
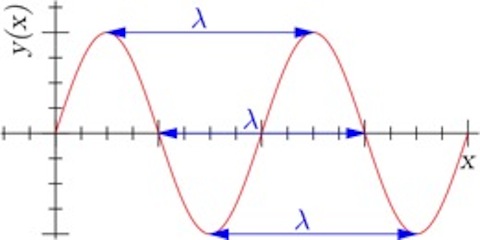
Image of a wave with wavelength λ. If the wave is moving to the right with speed v, then one can count how many cycles (say crests) go by per second. This would be the frequency (f=v/λ).
Image Credit: Dicklyon (Richard F. Lyon) via Wikimedia Commons.
You might think of phase as where in the cycle the wave is starting, or, if you are comparing two identical waves, it describes how far ahead one wave is relative to the other.
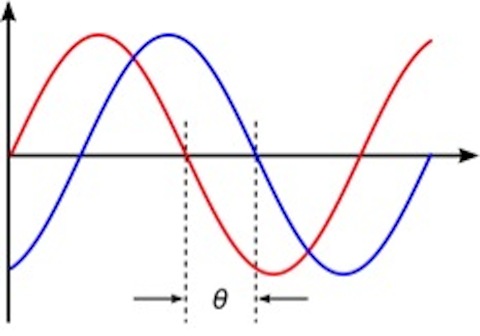
Two waves with the same frequency, wavelength, speed, and amplitude but there is a phase difference θ between them.
Image Credit: Peppergrower via Wikimedia Commons
Below is a constructed image of a wave propagating through a single medium (say light through air). The image on the left shows a wave traveling through air and for a short time through a second medium, for example a thin piece of glass. When the wave leaves the thin piece of glass, it has been phase shifted, and the difference in phase between the original light wave and the light that passed through the glass tells us something about the glass.
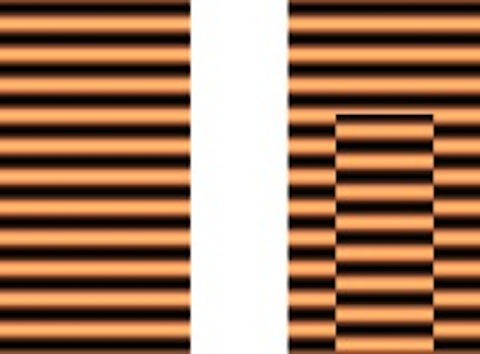
Left image models light wave traveling from top to bottom with no interaction with another medium. Right image models light travel from top to bottom and passing for a short time through a thin piece of glass centered in the air column. A phase shift occurs due to light going through a different material.
Image Credit: Oleg Alexandrov
There is more than one way to use phase shifts to enhance imaging. In 1956 Frits Zernicke won the Nobel Prize in physics for figuring out a way to enhance microscopic viewing by using the phase information. When light shines through a transparent sample, some light goes through the sample but some light does not.
The light going through the sample experiences phase shifts. Our eyes cannot detect phase shifts, just changes in intensity, and therefore we cannot resolve well the transparent object because the background light is very intense compared to the light passing through the sample.
However if we phase shift the background light (make it go through something like glass) to create a 90˚ phase shift, we reduce its intensity but increase the contrast between light going through the sample and the background light. This is what Zernicke did for his Nobel Prize winning research.
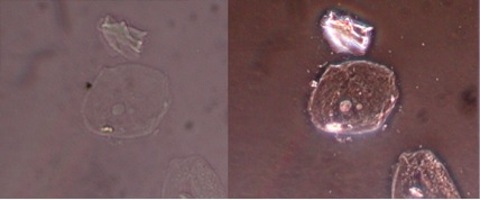
Imaging without (left) and with (right) a phase contrast microscope.
Image Credit: GcG via Wikimedia Commons
X-Rays and Papyrus
The X rays in the papyri experiment could penetrate the scrolls but the differences in absorption of X rays between the ink and the charred papyrus resulted in no discernable contrast between ink and “paper.” For the experiment done with the scrolls, the researchers didn’t phase shift the background X-rays. Instead, they used the phase differences between X-rays traveling through the scroll and those going undisturbed to gain the information of the scroll.
X-rays traveling through the scroll undergo phase differences, and spatial deviations compared to X-rays that go undisturbed to the detector. X-rays from different paths diffract and interfere to produce a greater intensity (constructive interference) or reduced intensity (destructive interference) depending on their phase differences at the point of detection.
These spatial deviations form characteristic patterns and the phase variations create measurable intensity variations, providing a way to discern ink and papyri as well as different layers within a charred papyrus roll. In particular, edges are well contrasted with this set-up – and the ink has definite structure over the papyrus. This technique is called propagation-based phase-contrast imaging, and requires a reliable source of semi-coherent X-rays, produced at a synchrotron.
The experimental set-up is shown below.1 X-rays produced at the European Synchrotron Research Facility (ESRF) in Grenoble, France. This synchrotron radiation is created by accelerating electrons to near the speed of light through 600 billion electron volts around a storage ring in fixed magnetic fields.
The X rays produced are very energetic, and the researchers optimized their experiment by selecting with a monochrometer (see image) X-rays of 70keV, which corresponds to X-rays with a wavelength of about 17.7 trillionths of a meter, and a frequency of about 1.69x10¹⁹ cycles per second.
The scientists send these X-rays through the sample (charred papyrus). The X-rays that go through the ink, versus the papyrus are phase shifted and deflected by different amounts.
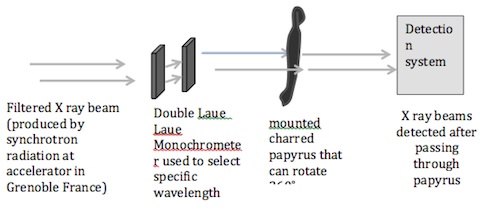
An advanced computer system assists them in gathering data from specific locations within the three-dimensional object. This is used to analyze the intensity variations and spatial variations to determine different layers of the roll, and features on the roll at a given layer. This is the tomography part of the experiment.
Tomography
The scientists are able to focus in on single slices of their sample by measuring X-rays coming from a specific slice or plane and reconstruct that slice. Doing this for all the slices creates the reconstruction of the three-dimensional object. This same technique is used in medical imaging. For example, CT scans where radiologists use X-rays to image our soft tissue and bones capitalize on this technique, but CTs use absorption differences.
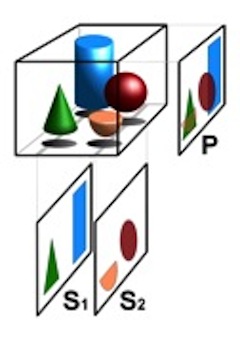
Tomography illustration principle.
Image Credit: Dtrx via Wikimedia Commons
In the images below we see the X-ray of the entire scroll on the left, and on the right, the scientists have used a method involving a computer program to follow along one of the contours within the scroll and pull out this rolled layer.

X-ray image of the scroll and pulling out one layer of the scroll.
Image Credit: V. Mocella
Once the layer is pulled out, they can look for measurable differences in the intensity occurring from this layer, and image what is causing those differences.
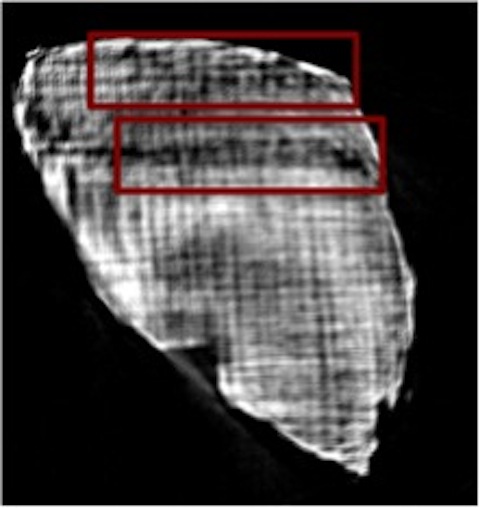
Two words in a hidden layer of the fragment PHerc.Paris. 1 fr. 101, (see Fig. 1 in the paper). The top section contains the sequence of Greek capital letters PIPTOIE (pi-iota-pi-tau- omicron-iota-epsilon); the bottom section of the letter contains the sequence of the next line, EIPOI (epsilon-iota-pi-omicron-iota)
Watch the one minute video below that shows the scroll they worked on and the imaging of a letter deeply embedded within the charred scroll.
Future Work
Dr. Mocella said a series of experiments are already planned at European Synchrotron in Grenoble to improve the experimental technique. They have planned experiments to determine the exact composition of the ink. He also said that they “are engaged in the development of new algorithms to improve the data analysis, which is particularly difficult for such complex task.
The scientists hope their method will be used to read the many carbonized scrolls from the Herculaneum library. Their methods might also be applied to other archeologically significant works too fragile to work with by other means, and perhaps as a forensic method for charred items.
References and Resources
1. Mocella, V., et al., Revealing letters in rolled Herculaneum papyri by X-ray phase-contrast imaging, Nat. Commun. 6, 5895, (2015) doi: 10.1038/ncomms6895http://www.nature.com/ncomms/2015/150120/ncomms6895/full/ncomms6895.html
2. Wade, L., Physicists read scrolls scorched by ancient volcano, Science/ AAAS News/ 20 January 2015.
http://news.sciencemag.org/archaeology/2015/01/physicists-read-scrolls-scorched-ancient-volcano
—H.M. Doss


