Lighting Up Wall Street

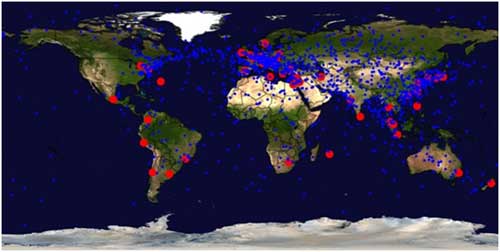
Map showing ideal locations worldwide for computerized financial stock trading.
Image courtesy of Alex Wissner Gross (MIT) and Cameron Freer (University of Hawaii) (2011)
This image shows the best locations throughout the world for computerized financial stock trading floors, represented by blue dots. The actual locations of 52 current major stock exchanges are represented by red dots. The blue dots are basically the midpoint between major financial centers in the world, marking the place where computers that do high frequency trading would have the best advantage in making the transactions before everyone else. This practice could be considered unethical and in reality, it’s improbable considering that each blue dot would have to be a manmade island floating on the seas, with its sole inhabitant, a computer meant for playing the stock market.
How is this advantage achieved? The discrepancy of how quickly information is relayed, or lag time between when information is sent and when it is received, allows for some computers to make quick choices and investments when opportunities present themselves What does this have to do with physics? Information is often relayed through fiber optics, sending information through beams of light carried through these cables. Fiber optics allow information to travel at near the speed of light. Physicists are no stranger to the speed of light and this map shows how Physicists have applied their knowledge of the speed of light to show where financial advantages could be gained. This is the kind of trading where milliseconds matter in how much money is gained or lost and can mean the difference between striking it rich or going poor.
The speed of light could turn the middle of the ocean into a stock-trading center


