Analyzing Water with Lasers and Levitation
August 17, 2018
Water is essential for life, but how can we be sure that our water is safe to drink? The ongoing Flint crisis of lead and other toxic metals in drinking water has raised alarm around the country, but new research using sound waves and lasers promises to bring some peace of mind by providing a simple option for field testing.
Atomic fingerprints
Matter interacts with electromagnetic waves, be they microwaves, infrared, visible light, or X-rays, in a very particular way. Thanks to the quantized nature of the allowed energy levels for the electrons in an atom, individual atoms only absorb and emit certain frequencies of light, and these frequencies define an inherent characteristic of the element that acts like a fingerprint for it. Molecules, comprised of multiple atoms, also have unique fingerprints, particularly in the infrared region of the electromagnetic spectrum.
As an example, let’s consider the simplest atom: the hydrogen atom, which has one proton in its nucleus and one electron bound to that nucleus. The electron is negatively charged and is attracted to the positively charged proton, but it is only bound to the proton in energy states located at specific distances from the nucleus, and cannot be at locations between these allowed states. Charged particles, such as electrons, interact with individual packets of electromagnetic energy—photons—which carry a certain amount of energy directly proportional to their frequency. When a photon has the same amount of energy as the difference between the lower-energy state a particle is in and an available higher-energy state, then the particle can absorb the photon and move to that higher state. If the photon’s energy is not equal to the energy difference between the particle’s state and another state, it will pass by undisturbed. This is why liquid water, for example, is transparent at visible wavelengths, but absorbs infrared radiation. The electromagnetic energy absorbed is called the absorption spectrum, and is usually observed as dark lines on a rainbow-like visible spectrum, due to the reduction of light at certain energies characterized by the photon’s frequency.
In nature, objects such as atoms don’t stay in an excited state for very long. Eventually the electron will drop back down to a lower state and emit a photon that has energy equal to the difference between the upper and lower energy states of the electron. The electromagnetic energy given off by a particular molecule or atom is called its emission spectrum. The visible emission spectrum for the hydrogen atom is shown below. Note that the wavelength of the light is inversely proportional to the frequency of the light, so either can be used as an indicator of the spectrum. The absorption spectrum in the visible region occurs at the same wavelengths (and frequencies) as the emission spectrum.

The visible emission spectrum of the hydrogen atom.
Image Credit: Wikimedia users Merikanto & Adrignola (CC0 1.0, Public Domain)
Scientists use this type of spectroscopy to determine what stars are made of, the contents of atmospheres, and what elements (aside from hydrogen and oxygen) are in a water sample.
Laser spectroscopy: What's in your water?
To see what different kinds of atoms are in a sample, those atoms have to be excited, which is where the lasers come in. LIBS, or Laser Induced Breakdown Spectroscopy can be used to determine the elements that make up a sample, be it solid, liquid, or gas. The laser is fired in a short pulse, and has a high enough energy to remove and break down a small portion of the material into a plasma state,where electrons are not bound to nuclei. Then, as the electrons re-bind to the nuclei returning to their lowest allowed energy state, they emit wavelengths characteristic of the elements, allowing for their identification! While there are lots of ways to study a material’s composition, the beauty of LIBS is that it is compact and portable, making it easy to bring into the field.
The hard part of measuring what’s in water is that there are other effects that go on with the surface of a liquid that cause “noise” or extra background wavelengths in the results. This makes it very hard, for example, to detect the emission spectra of metals in water when the metal concentration is low. Water is a polar molecule, having one side that is more negatively charged and another that is more positively charged, and scientists have taken advantage of this to levitate water droplets by placing them between two charged metal plates—a process that makes LIBS easier. One of the advantages of having the droplet trapped like this is allowing it to evaporate to a smaller drop size; this reduces the energy of the laser pulse needed for breakdown, and increases the concentration of other materials since they generally do not evaporate with the water. The decrease of water and increase of contaminant concentration reduces the amount of noise, and hence makes it possible to easily detect the emission signals of the materials in the water. It’s important to know the initial concentration of materials in the water, but this can still easily be calculated since the original drop size is recorded. It is also important not to let the drop size get too small, because the laser pulse will cause the drop to be pushed out of the trap rather than turning it into a plasma.
But recent research has led to a new approach for getting the water droplets to float:acoustic levitation. And the beauty of this method is that it also works for materials that are not polar and so cannot be levitated with charged plates.
Sound waves are a type of longitudinal or compression wave, meaning the material is compressed in the direction that the waves travel—as shown below in the slinky video.
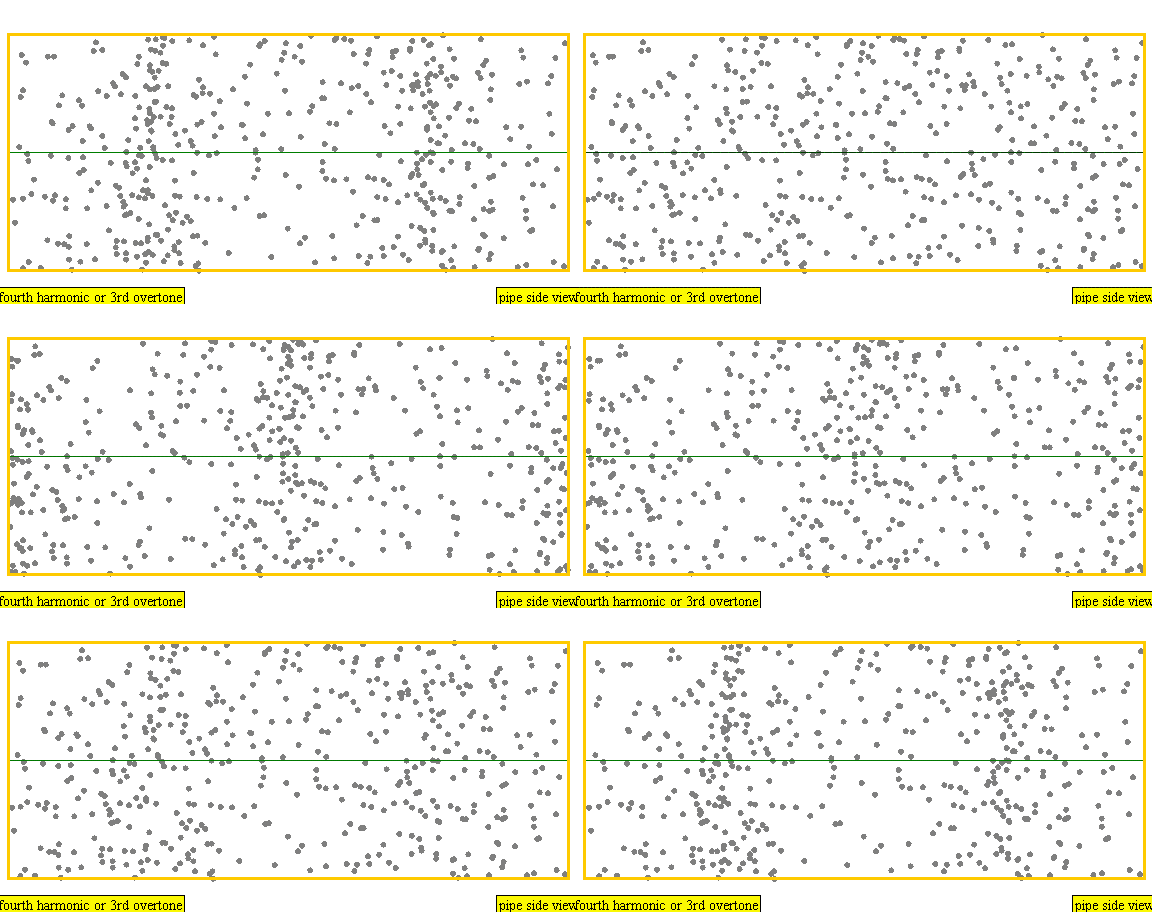
The sound waves used in the new device travel between two concave (bowl shaped) regions that set up a standing wave pattern, much like a standing wave created in the pipe of a musical wind instrument. The incident wave interferes with the reflected wave (meaning their amplitudes add up) causing regions where the air does not move; these are called nodes. Figures 4 and 5 show how the speed of air particles in a pipe closed at both ends changes in time, and how the location of particles changes in time, respectively. The images are for what is known as the fourth harmonic of the pipe. The fourth harmonic is four times the fundamental or four times the smallest frequency that fits in the closed pipe.

A wave representation of particles' displacement in a pipe closed at both ends. The image is for the fourth harmonic. The fourth harmonic is four times the fundamental frequency, the smallest frequency of oscillation that fits in the closed pipe.
Image Credit: Wikimedia user Lookang, derived from work by Juan Aguirregabiria. (CC BY-SA 3.0)

Simulation showing the motion of air particles in a pipe closed at both ends with a fourth harmonic sound wave. The locations where the particles do not seem to move at all are called nodes and correspond to where the curve in the previous figure crosses the axes.
Image Credit: Wikimedia user Lookang, derived from work by Juan Aguirregabiria. (CC BY-SA 3.0)
The acoustic levitation device is shown in the video below, where a test particle representing the water droplet is first moved from one node to another, and then held at that node while the researcher moves the portable instrument around.
When actual water is used in the device, the water drop is held in place in the trap created by sound waves and allowed to evaporate. The smaller size enables the LIBS method to increase its ability to detect heavy metals in water. You can watch the acoustic levitation trap in action in the video below:
Image Credit: Victor Contreras
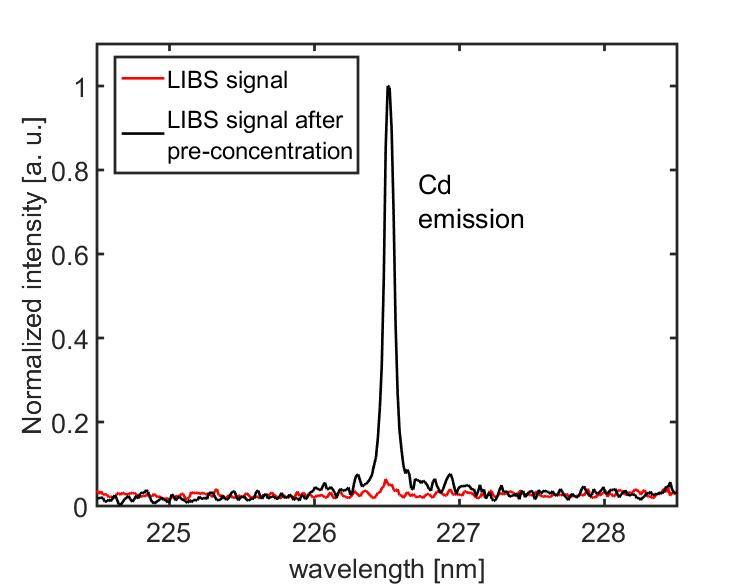
To test their new method, the researchers created different concentrations of metals in purified water. The data shown below is an example of the emission spectrum for a drop of water at a concentration of 50 milligrams of cadmium per liter. The red line shows the emission spectrum that results when LIBS is performed on a water droplet 0.780 millimeters in diameter. The black line shows the emission spectrum that results when LIBS is performed on the same sized drop AFTER it is allowed to evaporate to a size of 0.250 millimeters.

This graph shows the signature wavelength of cadmium in a droplet of water analyzed with LIBS. The red line is the LIBS signal for a larger drop of water, while the black line represents the signal of a drop of water allowed to evaporate to a smaller size.
Image Credit: Victor Contreras
Future research and development
The researchers show in their Optics Letters article that acoustic levitation allows for stable, reproducible LIBS testing of water. They suggest that proper automation of the device will make it very useful in the field and allow for testing of a wide variety of materials that cannot be levitated with electric or magnetic fields.
References & Further Resources
1. Contreras, V., Valencia, R. Peralta, J., Sobral, H., Meneses-Nava, M. A., and Martinez, H. “Chemical elemental analysis of single acoustic-levitated water droplets by laser-induced breakdown spectroscopy,” Opt. Lett. 43 10 pp.2260-2263 (2018)
https://doi.org/10.1364/OL.43.002260
2. Media Relations, “Researchers Levitate Water Droplets to Improve Contaminant Detection,” OSA Newsroom, 3 May 2018
https://www.osa.org/en-us/about_osa/newsroom/news_releases/2018/
—H.M. Doss


