Physics and Math Predict Supreme Court Votes
Legal experts regularly try to predict the votes of Supreme Court justices with largely little success. While the lawyers focus on the content of the cases, a team of one physicist and one engineer decided to take a different route. Focusing on the math behind past decisions revealed subtle voting patterns, allowing the researchers to predict individual Supreme Court judges’ votes with high accuracy. In fact, they correctly predicted over 80 percent of the votes.

Several studies have analyzed legal scholars', lawyers', judges', and court clerks’ ability to predict entire cases. The results aren’t pretty. Often, these experts predict Supreme Court decisions with little more accuracy than a coin toss. Sometimes, they performed even worse. In 2002, for instance, experts only correctly predicted about 60 percent of the Supreme Court’s decisions.
These predictions, of course, focus on the content of each decision. But what if there were underlying mathematical patterns in the justices’ voting history that proved more reliable predictors? This question prompted Spanish researchers Roger Guimera and Marta Sales-Pardo to investigate.
The Physics of Votes
To be clear, Guirmera and Sales-Pardo weren’t predicting entire Supreme Court decisions like most legal scholars have done in the past. Consequently, direct comparisons of this physics-based research with the legal experts’ predictions are slightly dubious. Nonetheless, their ability to reliably predict individual voting patterns of justices is impressive, especially because they ignore the key legal facts surrounding the case.
The researchers first gathered the complete voting record of the court up until a certain case. This, combined with the votes of eight of the justices in the current case, allowed the researchers to predict the probability that the last judge would vote in favor of the petitioner (the person who initiated the case).
For their model, the researchers adapted methods used to track interactions in complex social networks, such as Twitter. Eventually, the team derived a probability equation that looks very similar to an equation used in thermodynamics.
Their equation is actually analogous to an equation used in statistical physics to calculate thermal averages. Much of the research surrounding social networks and the field of “sociophysics” actually has foundations in statistical mechanics: the backbone of thermodynamics.
Statistical mechanics allows researchers to explain everyday phenomena, such as temperature, through the various possible arrangements of microscopic states. For the Supreme Court research, the team ultimately drew inspiration from this field.
The model begins to lump justices and cases into “blocks” based on how the judges vote relative to one another. In an ideal court, a judge’s previous voting record relative to other judges shouldn’t affect how they vote in the future, according to the researchers. But the team’s analysis has shown that the Supreme Court may be far from ideal.
The Results
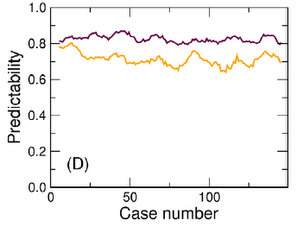
When put to the test, the model predicted like a champ, correctly returning a justice’s vote 83 percent of the time. But the model truly proves itself when analyzing close cases where the judges are pretty evenly divided.
For three different scenarios, the researchers compared their models’ predictive success with a “majority rule” method of prediction. Under majority rule, they would simply predict that the ninth judge’s vote would follow the majority of the eight other justices whose votes are already known. If there was a tie, then the researchers would flip a coin to predict the final vote.
Majority rule actually works pretty well overall, correctly predicting a judge’s decision roughly 70 percent of the time. When there’s a sharp divide in the court (e.g. 5-4 decisions), however, majority rule fails miserably as a predictor.
The model shines under these scenarios. For instance, in 5-4 decisions, the model correctly predicted a judges’ vote 77 percent of the time. Majority rule only made the right prediction 28 percent of the time.


Right: The predictability of all votes in real courts. The purple line represents the team's model, and the yellow line represents the "majority rule" method. Left: This graph charts the predictability only for 5-4 decisions. Note that the model widely outperforms the majority rule method in these cases. Image Courtesy Roger Guimera and Marta Sales-Pardo via their arXiv article.
Although the team wasn’t predicting the outcome of entire cases, they still made highly accurate predictions of an individual judge’s votes. There haven’t been as many studies analyzing how well legal experts can predict individual votes, but their predictions for full cases have proved mediocre.
Apparently, there are some voting patterns that math can tease out of the voting record. This research may raise some questions about the impartiality of judges if their votes can be predicted without considering a new case’s merits.
Promisingly, the team did find that judges were becoming less predictable in recent years. Perhaps this is a sign that impartiality has crept back into the courtroom, but many experts and pundits would disagree.


