The Science Behind World Cup Passing Networks
As the world’s gaze turns to Brazil for the 2014 World Cup, statisticians, oddsmakers, and office bracket wizards are trying their best to predict the tournament’s outcome. There’s about as many approaches to predictions as there are prognosticators, but some are more refined than others.
FiveThirtyEight Sports, for instance, has a fairly elaborate predictive model from the group stage all the way up to the World Cup final. This model and other like it primarily use a team’s recent international record (and the past performances of its players) to predict game outcomes.
After the last World Cup in 2010, however, researchers Javier Lopez Pena (University College London) and Hugo Touchette (Queen Mary University of London) took a different approach to soccer statistics (their paper was published in 2012).
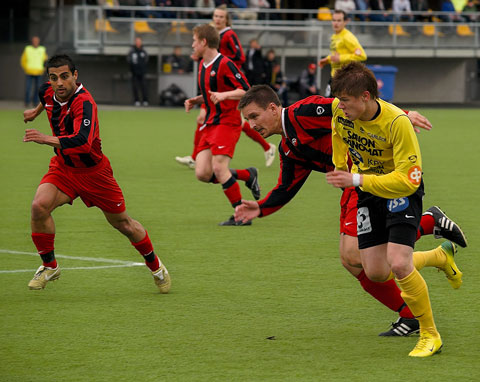
Image Credit: Ras via Wikimedia Commons. Rights Information
Passing Networks
Instead of focusing primarily on a team’s record and players’ individual performances, these two researchers looked at the official passing data from FIFA. This data allowed them to create a network model of players on the pitch, somewhat similar to the models used to predict disease outbreaks and the spread of information through social media networks.
With their model, the team aimed to discover the differences in strategy among the teams and determine if any general network properties proved critical to on-the-field success.
The network's nodes comprised of a team’s players and connections among the nodes represented passes among the players. The location of the players remained static — fixed to their assigned position at the start of the game.
In their paper, the researchers admit that such a representation doesn’t fully capture the fluid positions of players throughout the game; nonetheless, the model provided some fascinating insights into the most successful teams' strategies.
Perhaps the most striking insights stem from the visualizations of the passing networks seen below. The thickness of the arrows represents the number of passes from one player to another.
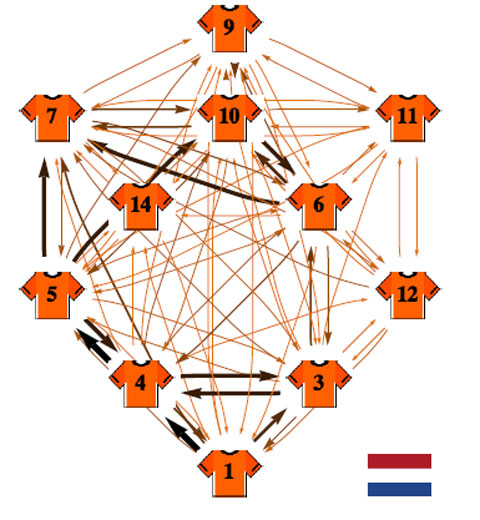
The passing network for the Netherlands. Thicker arrows represent a higher number of passes from that player to the other.
Image Credit: Javier Lopez Pena and Hugo Touchette via arXiv
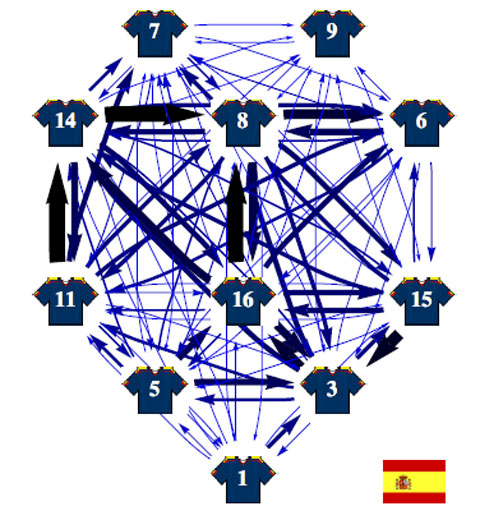
The passing network for the 2010 champion Spanish team.
Image Credit: Javier Lopez Pena and Hugo Touchette via arXiv
Networks on the Pitch
But there are many other variables to consider aside from just the number of passes between players. In fact, the researchers chose to focus on several other parameters typically used to measure networks including edge connectivity, average clustering, and average betweenness.
So what do all of these parameters measure?
Edge connectivity is “defined as the minimum number of edges one needs to remove to make the network disconnected,” according to the researchers' paper. The researchers note that this can help determine the “smallest number of passes that need to be intercepted to interrupt a team’s ‘natural flow.'”
A clustering coefficient measures the tendency of a network’s nodes to cluster around one another. The local clustering coefficient for an individual player would be high if a lot of passes bounce off of him to other players on the pitch. One might expect a midfielder to have a higher clustering coefficient than, say, a defender.
If a lot of players have this high level of clustering, then the average clustering value for the whole team will increase. If the team’s more unbalanced, this value will decrease.
The betweenness for an individual player differs slightly from the clustering coefficient. As Pena and Touchette write, “Betweenness does not measure how well-connected a player is, but rather how the ball-flow between other players depends on that particular player...” In short, this measures how critical a specific player might be to maintaining passing connections between other players.
Consequently, teams with a high average betweenness score might rely too much on just a few key players, concentrating their risk. If star players are removed due to a red card (unlikely) or isolated by a concentrated defensive strategy (more likely), high-betweenness teams’ strategy may fall flat.
Predictions and Insights
In the chart below, Pena and Touchette compiled these statistics for the teams who made it to the round of 16, along with a few other network parameters.
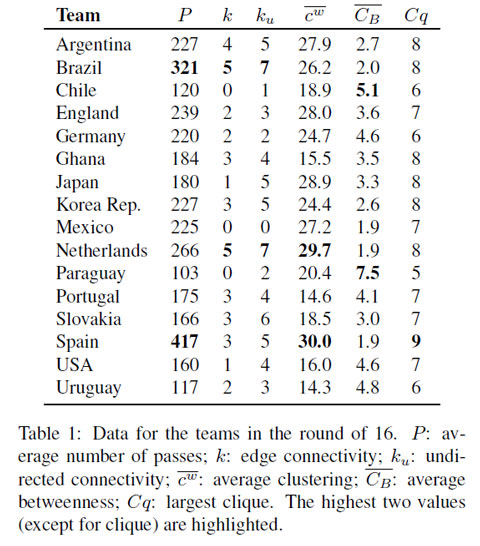
Image Credit: Javier Lopez Pena and Hugo Touchette via arXiv
Taking it a step further, I decided to compare the various values for the top 8 teams to see if any single parameter stood out as a predictor of success. The result was a bit of a wash.
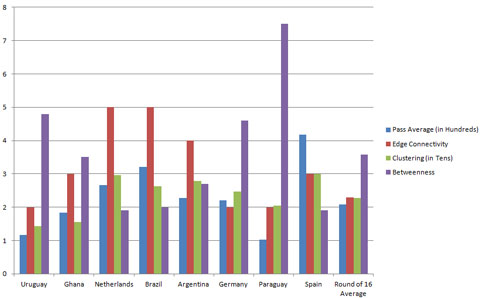
A comparison of the teams that made it to the round of 8. Click the image for a larger version.
The most successful teams (i.e. Netherlands and Spain) had above average passing averages, edge connectivity, and clustering while maintaining below average betweenness (suggesting the teams were more balanced).
Nonetheless, many teams made it through to the quarterfinals without above average parameters in some categories. Paraguay, Ghana, and Uruguay, for example, all had below average passing averages and clustering.
While some of the network parameters appear to have some predictive success, it seems that they are most useful at elucidating the individual style of each team. The Spaniards’ high passing average, low betweenness, and high edge connectivity reflected the teams’ oft-cited ‘tiki-taka’ style, according to the researchers.
In addition to evaluating teams holistically, Pena and Touchette also looked at the individual performances within each team. Spain’s players, for instance, had a fairly even distribution of betweenness among the players, suggesting a more cohesive, balanced execution.
Strikers across all teams had the lowest betweenness, likely because they wait for passes to come to them and infrequently act as critical pieces of ball-flow between other players.
Hopefully more researchers will be inspired to tackle the data from this year’s World Cup in Brazil once it’s all done. With more sophisticated data and modeling, teams may have better analysis of their own strategic execution, and science-savvy office bracketeers may gain a leg up on their coworkers.
-Brian Jacobsmeyer


